
Page 163 - Business Plans that Work A Guide for Small Business
P. 163
152 • Business Plans that Work
10.4 Balance Sheet
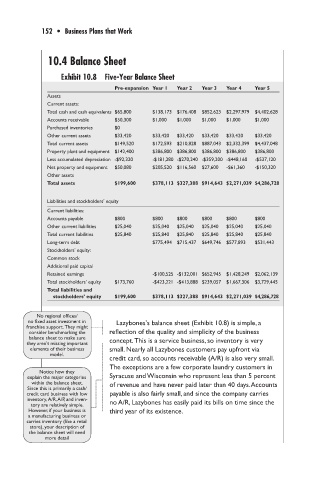
Exhibit 10.8 Five-Year Balance Sheet
Pre-expansion Year 1 Year 2 Year 3 Year 4 Year 5
Assets
Current assets:
Total cash and cash equivalents $65,800 $138,173 $176,408 $852,623 $2,297,979 $4,402,628
Accounts receivable $50,300 $1,000 $1,000 $1,000 $1,000 $1,000
Purchased inventories $0
Other current assets $33,420 $33,420 $33,420 $33,420 $33,420 $33,420
Total current assets $149,520 $172,593 $210,828 $887,043 $2,332,399 $4,437,048
Property plant and equipment $142,400 $386,800 $386,800 $386,800 $386,800 $386,800
Less accumulated depreciation -$92,320 -$181,280 -$270,240 -$359,200 -$448,160 -$537,120
Net property and equipment $50,080 $205,520 $116,560 $27,600 -$61,360 -$150,320
Other assets
Total assets $199,600 $378,113 $327,388 $914,643 $2,271,039 $4,286,728
Liabilities and stockholders’ equity
Current liabilities:
Accounts payable $800 $800 $800 $800 $800 $800
Other current liabilities $25,040 $25,040 $25,040 $25,040 $25,040 $25,040
Total current liabilities $25,840 $25,840 $25,840 $25,840 $25,840 $25,840
Long-term debt $775,494 $715,437 $649,746 $577,893 $531,443
Stockholders’ equity:
Common stock
Additional paid capital
Retained earnings -$100,525 -$132,001 $652,945 $1,428,249 $2,062,139
Total stockholders’ equity $173,760 -$423,221 -$413,888 $239,057 $1,667,306 $3,729,445
Total liabilities and
stockholders’ equity $199,600 $378,113 $327,388 $914,643 $2,271,039 $4,286,728
No regional offices/
no fixed asset investment in Lazybones’s balance sheet (Exhibit 10.8) is simple, a
franchise support. They might
consider benchmarking the reflection of the quality and simplicity of the business
balance sheet to make sure concept. This is a service business, so inventory is very
they aren’t missing important
elements of their business small. Nearly all Lazybones customers pay upfront via
model.
credit card, so accounts receivable (A/R) is also very small.
The exceptions are a few corporate laundry customers in
Notice how they
explain the major categories Syracuse and Wisconsin who represent less than 5 percent
within the balance sheet. of revenue and have never paid later than 40 days. Accounts
Since this is primarily a cash/
credit card business with low payable is also fairly small, and since the company carries
inventory, A/R, A/P, and inven- no A/R, Lazybones has easily paid its bills on time since the
tory are relatively simple.
However, if your business is third year of its existence.
a manufacturing business or
carries inventory (like a retail
store), your description of
the balance sheet will need
more detail