
Page 436 - Cam Design Handbook
P. 436
THB13 9/19/03 7:56 PM Page 424
424 CAM DESIGN HANDBOOK
Hertzian cam contact stress, s c (10 5 lb/in. 2 ) 0.7
0.5
Polydyne
Optimal
0.3
0.0 0.5 1.0
Normalized Time (T )
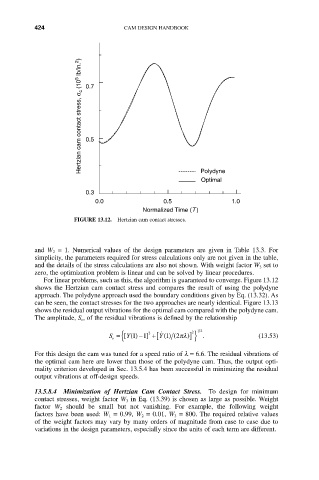
FIGURE 13.12. Hertzian cam contact stresses.
and W 2 = 1. Numerical values of the design parameters are given in Table 13.3. For
simplicity, the parameters required for stress calculations only are not given in the table,
and the details of the stress calculations are also not shown. With weight factor W 3 set to
zero, the optimization problem is linear and can be solved by linear procedures.
For linear problems, such as this, the algorithm is guaranteed to converge. Figure 13.12
shows the Hertzian cam contact stress and compares the result of using the polydyne
approach. The polydyne approach used the boundary conditions given by Eq. (13.32). As
can be seen, the contact stresses for the two approaches are nearly identical. Figure 13.13
shows the residual output vibrations for the optimal cam compared with the polydyne cam.
The amplitude, S v, of the residual vibrations is defined by the relationship
2 12
S = [ { Y() - ] +[ Y () (2pl )] } . (13.53)
˙
2
1
1
1
v
For this design the cam was tuned for a speed ratio of l = 6.6. The residual vibrations of
the optimal cam here are lower than those of the polydyne cam. Thus, the output opti-
mality criterion developed in Sec. 13.5.4 has been successful in minimizing the residual
output vibrations at off-design speeds.
13.5.8.4 Minimization of Hertzian Cam Contact Stress. To design for minimum
contact stresses, weight factor W 3 in Eq. (13.39) is chosen as large as possible. Weight
factor W 2 should be small but not vanishing. For example, the following weight
factors have been used: W 1 = 0.99, W 2 = 0.01, W 3 = 800. The required relative values
of the weight factors may vary by many orders of magnitude from case to case due to
variations in the design parameters, especially since the units of each term are different.