
Page 117 - Carbon Nanotubes
P. 117
106 A. SARKAR al.
et
value was chosen deltaf = 65 nm, where the sin(x) ary growth showed no regular structure in the HRTEM
transfer function has a large plateau at sin(x) ca. -1 images (Fig. l), suggesting that it might consist largely
against the interlayer spacing of carbon in the range of some form of “amorphous” carbon. After the sec-
5.0-2.8 A. These conditions were optimum for observ- ond stage of heat treatment, at 28OO0C, the amor-
ing high-contrast 002 lattice fringes form the PCNTs. phous sheaths graphitise to a very large degree,
The simulations were carried out on a Silicon producing multi-walled graphite nanotubes which tend
Graphics Iris Indigo workstation using the CERIUS to be sealed off at points where the spindle-like for-
molecular modeling and the associated HRTEM mod- mations are thinnest. The sealed-off end region of one
ule. The multislice simulation technique was applied such PCNT is shown in Fig. 1.
using the following parameters: electron energy 400 The detailed analysis of the way in which the over-
kV (lambda = 0.016 A); C, (aberration coefficient) = all and internal structure of PCNTs apparently arise
2.7 mm; focus value deltaf = 66 nm; beam spread = is discussed elsewhere[20]. Here, we draw attention to
0.30 mrad. some particularly interesting and unusual structures
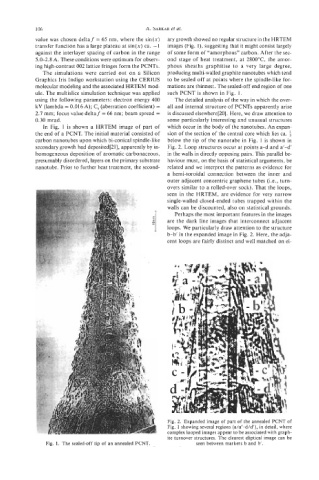
In Fig. 1 is shown a HRTEM image of part of which occur in the body of the nanotubes. An expan-
the end of a PCNT. The initial material consisted of sion of the section of the central core which lies ca. f
carbon nanotubes upon which bi-conical spindle-like below the tip of the nanotube in Fig. 1 is shown in
secondary growth had deposited[21], apparently by in- Fig. 2. Loop structures occur at points a-d and a‘-d‘
homogeneous deposition of aromatic carbonaceous, in the walls in directly opposing pairs. This parallel be-
presumably disordered, layers on the primary substrate haviour must, on the basis of statistical arguments, be
nanotube. Prior to further heat treatment, the second- related and we interpret the patterns as evidence for
a hemi-toroidal connection between the inner and
outer adjacent concentric graphene tubes (Le., turn-
overs similar to a rolled-over sock). That the loops,
seen in the HRTEM, are evidence for very narrow
single-walled closed-ended tubes trapped within the
walls can be discounted, also on statistical grounds.
Perhaps the most important features in the images
are the dark line images that interconnect adjacent
loops. We particularly draw attention to the structure
b-b‘ in the expanded image in Fig. 2. Here, the adja-
cent loops are fairly distinct and well matched on ei-
Fig. 2. Expanded image of part of the annealed PCNT of
Fig. 1 showing several regions (a/a’-d/d‘), in detail, where
complex looped images appear to be associated with graph-
ite turnover structures. The clearest eliptical image can be
Fig. 1. The sealed-off tip of an annealed PCNT seen between markers b and b’.