Page 50 - Carrahers_Polymer_Chemistry,_Eighth_Edition
P. 50

Introduction to Polymers                                                      13
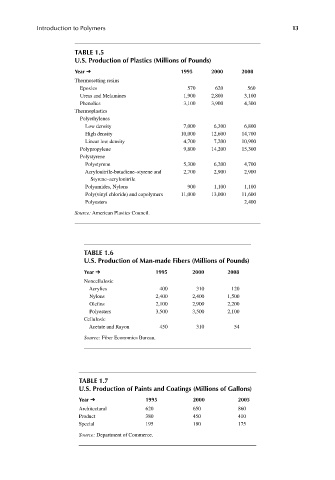


                             TABLE 1.5
                             U.S. Production of Plastics (Millions of Pounds)
                             Year ➔                          1995     2000     2008
                             Thermosetting resins
                              Epoxies                          570     620       560
                               Ureas and Melamines            1,900   2,800     3,100
                              Phenolics                       3,100   3,900     4,300
                             Thermoplastics
                              Polyethylenes
                               Low density                    7,000    6,300    6,800
                               High density                  10,000   12,600   14,700
                               Linear low density             4,700    7,200   10,900
                              Polypropylene                   9,800   14,200   15,300
                              Polystyrene
                               Polystyrene                    5,300    6,200    4,700
                                Acrylonitrile-butadiene–styrene and   2,700  2,900  2,900
                                Styrene–acrylonitrile
                               Polyamides, Nylons              900     1,100    1,100
                                 Poly(vinyl chloride) and copolymers  11,000  13,000  11,600
                               Polyesters                                       2,400
                             Source: American Plastics Council.


                                TABLE 1.6
                                U.S. Production of Man-made Fibers (Millions of Pounds)
                                Year ➔               1995        2000      2008
                                Noncellulosic
                                 Acrylics              400        310       120
                                 Nylons              2,400       2,400     1,500
                                 Olefi ns            2,100       2,900     2,200
                                 Polyesters          3,500       3,500     2,100
                                Cellulosic
                                  Acetate and Rayon    450        310        54
                                Source: Fiber Economics Bureau.


                              TABLE 1.7
                              U.S. Production of Paints and Coatings (Millions of Gallons)
                              Year ➔              1995           2000         2005
                              Architectural       620            650          860
                              Product             380            450          410
                              Special             195            180          175
                              Source: Department of Commerce.


                                                                                              9/14/2010   3:35:52 PM
         K10478.indb   13                                                                     9/14/2010   3:35:52 PM
         K10478.indb   13
   45   46   47   48   49   50   51   52   53   54   55