
Page 115 - Chalcogenide Glasses for Infrared Optics
P. 115
Characterization of Glass Pr operties 93
16
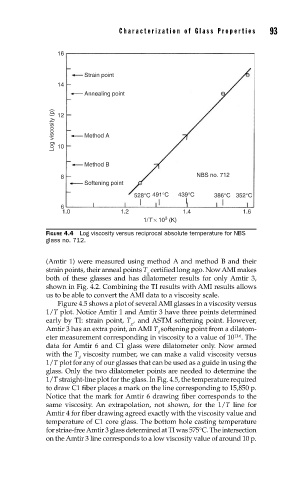
Strain point
14
Annealing point
Log viscosity (p) 12 Method A
10
Method B
8 NBS no. 712
Softening point
528°C 491°C 439°C 386°C 352°C
6
1.0 1.2 1.4 1.6
3
1/T × 10 (K)
FIGURE 4.4 Log viscosity versus reciprocal absolute temperature for NBS
glass no. 712.
(Amtir 1) were measured using method A and method B and their
strain points, their anneal points T certified long ago. Now AMI makes
g
both of these glasses and has dilatometer results for only Amtir 3,
shown in Fig. 4.2. Combining the TI results with AMI results allows
us to be able to convert the AMI data to a viscosity scale.
Figure 4.5 shows a plot of several AMI glasses in a viscosity versus
1/T plot. Notice Amtir 1 and Amtir 3 have three points determined
early by TI: strain point, T , and ASTM softening point. However,
g
Amtir 3 has an extra point, an AMI T softening point from a dilatom-
d
11.6
eter measurement corresponding in viscosity to a value of 10 . The
data for Amtir 6 and C1 glass were dilatometer only. Now armed
with the T viscosity number, we can make a valid viscosity versus
d
1/T plot for any of our glasses that can be used as a guide in using the
glass. Only the two dilatometer points are needed to determine the
1/T straight-line plot for the glass. In Fig. 4.5, the temperature required
to draw C1 fiber places a mark on the line corresponding to 15,850 p.
Notice that the mark for Amtir 6 drawing fiber corresponds to the
same viscosity. An extrapolation, not shown, for the 1/T line for
Amtir 4 for fiber drawing agreed exactly with the viscosity value and
temperature of C1 core glass. The bottom hole casting temperature
for striae-free Amtir 3 glass determined at TI was 575°C. The intersection
on the Amtir 3 line corresponds to a low viscosity value of around 10 p.