
Page 112 - Chalcogenide Glasses for Infrared Optics
P. 112
90 Cha pte r F o u r
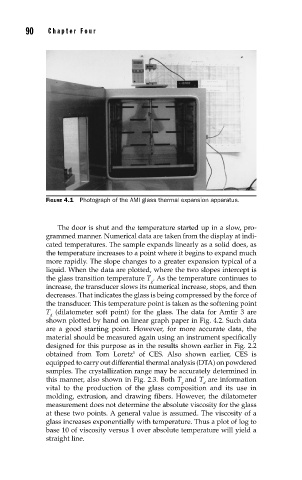
FIGURE 4.1 Photograph of the AMI glass thermal expansion apparatus.
The door is shut and the temperature started up in a slow, pro-
grammed manner. Numerical data are taken from the display at indi-
cated temperatures. The sample expands linearly as a solid does, as
the temperature increases to a point where it begins to expand much
more rapidly. The slope changes to a greater expansion typical of a
liquid. When the data are plotted, where the two slopes intercept is
the glass transition temperature T . As the temperature continues to
g
increase, the transducer slows its numerical increase, stops, and then
decreases. That indicates the glass is being compressed by the force of
the transducer. This temperature point is taken as the softening point
T (dilatometer soft point) for the glass. The data for Amtir 3 are
d
shown plotted by hand on linear graph paper in Fig. 4.2. Such data
are a good starting point. However, for more accurate data, the
material should be measured again using an instrument specifically
designed for this purpose as in the results shown earlier in Fig. 2.2
1
obtained from Tom Loretz of CES. Also shown earlier, CES is
equipped to carry out differential thermal analysis (DTA) on powdered
samples. The crystallization range may be accurately determined in
this manner, also shown in Fig. 2.3. Both T and T are information
g d
vital to the production of the glass composition and its use in
molding, extrusion, and drawing fibers. However, the dilatometer
measurement does not determine the absolute viscosity for the glass
at these two points. A general value is assumed. The viscosity of a
glass increases exponentially with temperature. Thus a plot of log to
base 10 of viscosity versus 1 over absolute temperature will yield a
straight line.