
Page 134 - Chalcogenide Glasses for Infrared Optics
P. 134
Characterization of Glass Pr operties 111
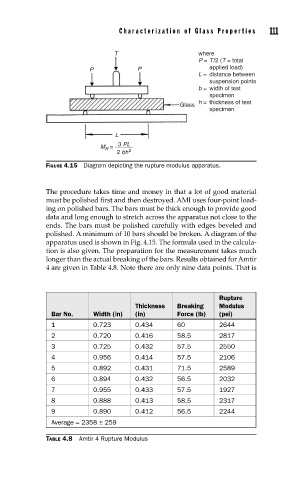
T where
P = T/2 (T = total
P P applied load)
L = distance between
suspension points
b = width of test
specimen
h = thickness of test
Glass
specimen
L
3 PL
M =
R
2 bh 2
FIGURE 4.15 Diagram depicting the rupture modulus apparatus.
The procedure takes time and money in that a lot of good material
must be polished first and then destroyed. AMI uses four-point load-
ing on polished bars. The bars must be thick enough to provide good
data and long enough to stretch across the apparatus not close to the
ends. The bars must be polished carefully with edges beveled and
polished. A minimum of 10 bars should be broken. A diagram of the
apparatus used is shown in Fig. 4.15. The formula used in the calcula-
tion is also given. The preparation for the measurement takes much
longer than the actual breaking of the bars. Results obtained for Amtir
4 are given in Table 4.8. Note there are only nine data points. That is
Rupture
Thickness Breaking Modulus
Bar No. Width (in) (in) Force (lb) (psi)
1 0.723 0.434 60 2644
2 0.720 0.416 58.5 2817
3 0.725 0.432 57.5 2550
4 0.956 0.414 57.5 2106
5 0.892 0.431 71.5 2589
6 0.894 0.432 56.5 2032
7 0.955 0.433 57.5 1927
8 0.888 0.413 58.5 2317
9 0.890 0.412 56.5 2244
Average = 2358 ± 259
TABLE 4.8 Amtir 4 Rupture Modulus