
Page 136 - Chalcogenide Glasses for Infrared Optics
P. 136
Characterization of Glass Pr operties 113
the heat reservoir and ones in the tip of the sensor tube begin to develop
a voltage difference. When the voltage becomes steady, the reading is
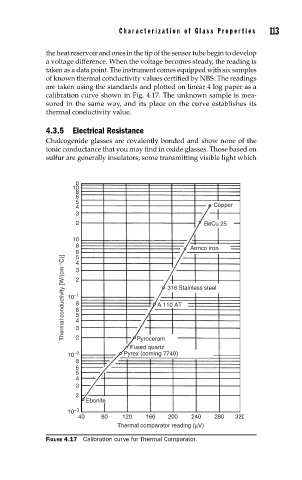
taken as a data point. The instrument comes equipped with six samples
of known thermal conductivity values certified by NBS. The readings
are taken using the standards and plotted on linear 4 log paper as a
calibration curve shown in Fig. 4.17. The unknown sample is mea-
sured in the same way, and its place on the curve establishes its
thermal conductivity value.
4.3.5 Electrical Resistance
Chalcogenide glasses are covalently bonded and show none of the
ionic conductance that you may find in oxide glasses. Those based on
sulfur are generally insulators, some transmitting visible light which
0
10
8
6
5
4 Copper
3
2 BeCu 25
10
8 Armco iron
6 5 4 3
Thermal conductivity [W/(cm·°C)] 10 –1 2 8 6 5 4 A 110 AT
316 Stainless steel
3
2
Pyroceram
Fused quartz
10 –2 Pyrex (corning 7740)
8
6
5
4
3
2
Ebonite
10 –3
40 80 120 160 200 240 280 320
Thermal comparator reading (µV)
FIGURE 4.17 Calibration curve for Thermal Comparator.