
Page 48 - Chalcogenide Glasses for Infrared Optics
P. 48
26 Cha pte r T w o
9.5
this instrument, T is also defined in viscosity terms as 10 poise. If
d
the glass temperature curve is approached from the other direction,
i.e., cooling from above the softening point toward room tempera-
ture, the shape will be slightly different depending upon the rate of
cooling (quench). As the glass is cooled into the T range, the slope
g
then decreases and begins to level out to a value typical of a solid.
Different rates of cooling produce a family of curves slightly separated
from one another. The slight differences are reflected in the density
and thus the resultant refractive index. For this reason, the thermal
history of a glass is important. To stabilize the refractive index from
batch to batch, the quenching process and the annealing procedure
must be established and consistently followed when the glass is pro-
duced. Nucleation and growth of small crystallites in a glass melt do
occur depending upon composition and temperature. The process
requires movement of atoms to come together to form molecules of
exact composition ratios. Such processes are much more difficult in
viscous melts and occur slowly if at all. As the temperature increases,
the viscosity decreases, making the crystallization process possible.
Thus, the crystallization process is time- and temperature-dependent.
29
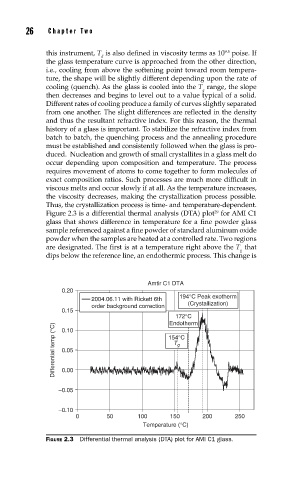
Figure 2.3 is a differential thermal analysis (DTA) plot for AMI C1
glass that shows difference in temperature for a fine powder glass
sample referenced against a fine powder of standard aluminum oxide
powder when the samples are heated at a controlled rate. Two regions
are designated. The first is at a temperature right above the T that
g
dips below the reference line, an endothermic process. This change is
Amtir C1 DTA
0.20
2004.06.11 with Rickett 6th 194°C Peak exotherm
order background correction (Crystallization)
0.15
172°C
Endotherm
Differential temp (°C) 0.05 154°C
0.10
T
g
0.00
–0.05
–0.10
0 50 100 150 200 250
Temperature (°C)
FIGURE 2.3 Differential thermal analysis (DTA) plot for AMI C1 glass.