
Page 232 - Challenges in Corrosion Costs Causes Consequences and Control(2015)
P. 232
210 CORROSION CONTROL AND PREVENTION
TABLE 4.5 Summary for Corrosion Control Coatings Sold in 1997
Corrosion Control Coatings Cost $× million
Total architectural corrosion control coatings 486
Total OEM corrosion control coatings 3797
Total special purpose corrosion control coatings 2298
Total miscellaneous allied corrosion control points 118
Total $6699
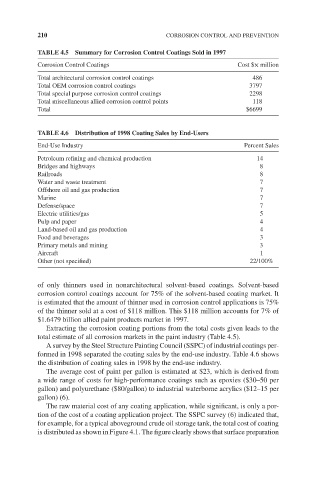
TABLE 4.6 Distribution of 1998 Coating Sales by End-Users
End-Use Industry Percent Sales
Petroleum refining and chemical production 14
Bridges and highways 8
Railroads 8
Water and waste treatment 7
Offshore oil and gas production 7
Marine 7
Defense/space 7
Electric utilities/gas 5
Pulp and paper 4
Land-based oil and gas production 4
Food and beverages 3
Primary metals and mining 3
Aircraft 1
Other (not specified) 22/100%
of only thinners used in nonarchitectural solvent-based coatings. Solvent-based
corrosion control coatings account for 75% of the solvent-based coating market. It
is estimated that the amount of thinner used in corrosion control applications is 75%
of the thinner sold at a cost of $118 million. This $118 million accounts for 7% of
$1.6479 billion allied paint products market in 1997.
Extracting the corrosion coating portions from the total costs given leads to the
total estimate of all corrosion markets in the paint industry (Table 4.5).
A survey by the Steel Structure Painting Council (SSPC) of industrial coatings per-
formed in 1998 separated the coating sales by the end-use industry. Table 4.6 shows
the distribution of coating sales in 1998 by the end-use industry.
The average cost of paint per gallon is estimated at $23, which is derived from
a wide range of costs for high-performance coatings such as epoxies ($30–50 per
gallon) and polyurethane ($80/gallon) to industrial waterborne acrylics ($12–15 per
gallon) (6).
The raw material cost of any coating application, while significant, is only a por-
tion of the cost of a coating application project. The SSPC survey (6) indicated that,
for example, for a typical aboveground crude oil storage tank, the total cost of coating
is distributed as shown in Figure 4.1. The figure clearly shows that surface preparation