
Page 74 - Characterization and Properties of Petroleum Fractions
P. 74
P2: —/—
T1: IML
QC: —/—
P1: KVU/—
AT029-Manual-v7.cls
16:6
August 16, 2007
AT029-02
AT029-Manual
54 CHARACTERIZATION AND PROPERTIES OF PETROLEUM FRACTIONS
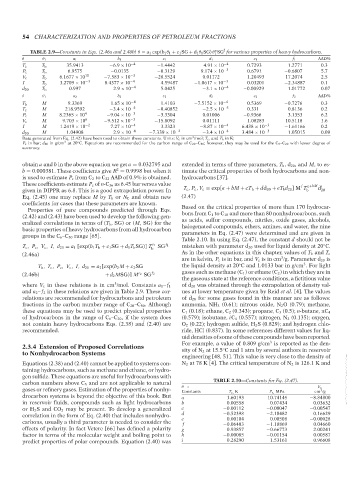
TABLE 2.9—Constants in Eqs. (2.46a and 2.46b) θ = a 1 exp(b 1 θ 1 + c 1 SG + d 1 θ 1 SG) θ SG for various properties of heavy hydrocarbons.
1 e f
θ θ 1 a 1 b 1 c 1 d 1 e 1 f 1 AAD%
T c T b 35.9413 −6.9 × 10 −4 −1.4442 4.91 × 10 −4 0.7293 1.2771 0.3
P c T b 6.9575 −0.0135 −0.3129 9.174 × 10 −3 0.6791 −0.6807 5.7
V c T b 6.1677 × 10 10 −7.583 × 10 −3 −28.5524 0.01172 1.20493 17.2074 2.5
I T b 3.2709 × 10 −3 8.4377 × 10 −4 4.59487 −1.0617 × 10 −3 0.03201 −2.34887 0.1
d 20 T b 0.997 2.9 × 10 −4 5.0425 −3.1 × 10 −4 −0.00929 1.01772 0.07
θ θ 1 a 2 b 2 c 2 d 2 e 2 f 2 AAD%
M 9.3369 1.65 × 10 −4 1.4103 −7.5152 × 10 −4 0.5369 −0.7276 0.3
T b
T c M 218.9592 −3.4 × 10 −4 −0.40852 −2.5 × 10 −5 0.331 0.8136 0.2
P c M 8.2365 × 10 4 −9.04 × 10 −3 −3.3304 0.01006 −0.9366 3.1353 6.2
V c M 9.703 × 10 6 −9.512 × 10 −3 −15.8092 0.01111 1.08283 10.5118 1.6
I M 1.2419 × 10 −2 7.27 × 10 −4 3.3323 −8.87 × 10 −4 6.438 × 10 −3 −1.61166 0.2
d 20 M 1.04908 2.9 × 10 −4 −7.339 × 10 −2 −3.4 × 10 −4 3.484 × 10 −3 1.05015 0.09
3
Data generated from Eq. (2.42) have been used to obtain these constants. Units: V c in cm /mol; T c , and T b in K;
3
P c in bar; d 20 in g/cm at 20 C. Equations are recommended for the carbon range of C 20 –C 50 ; however, they may be used for the C 5 –C 20 with lesser degree of
◦
accuracy.
obtain a and b in the above equation we get a = 0.032795 and extended in terms of three parameters, T b ,d 20 , and M, to es-
2
b = 0.000381. These coefficients give R = 0.9998 but when it timate the critical properties of both hydrocarbons and non-
is used to estimate P c from C 2 to C 22 AAD of 0.9% is obtained. hydrocarbons [37].
These coefficients estimate P c of n-C 36 as 6.45 bar versus value f g+hM i
given in DIPPR as 6.8. This is a good extrapolation power. In T c , P c , V c = exp[a + bM + cT b + dd 20 + eT b d 20 ]M T b d 20
Eq. (2.45) one may replace M by T b or N C and obtain new (2.47)
coefficients for cases that these parameters are known.
Properties of pure compounds predicted through Eqs. Based on the critical properties of more than 170 hydrocar-
(2.42) and (2.43) have been used to develop the following gen- bons from C 1 to C 18 and more than 80 nonhydrocarbons, such
eralized correlations in terms of (T b , SG) or (M, SG) for the as acids, sulfur compounds, nitriles, oxide gases, alcohols,
halogenated compounds, ethers, amines, and water, the nine
basic properties of heavy hydrocarbons from all hydrocarbon parameters in Eq. (2.47) were determined and are given in
groups in the C 6 –C 50 range [65].
Table 2.10. In using Eq. (2.47), the constant d should not be
T c , P c , V c , I, d 20 = a 1 [exp(b 1 T b + c 1 SG + d 1 T b SG)] T e 1 SG f 1 mistaken with parameter d 20 used for liquid density at 20 C.
◦
b
(2.46a) As in the other equations in this chapter, values of T b and T c
3
are in kelvin, P c is in bar, and V c is in cm /g. Parameter d 20 is
3
T b , T c , P c , V c , I, d 20 = a 2 [exp(b 2 M + c 2 SG the liquid density at 20 C and 1.0133 bar in g/cm . For light
◦
gases such as methane (C 1 ) or ethane (C 2 ) in which they are in
(2.46b) + d 2 MSG)] M SG f 2
e 2
the gaseous state at the reference conditions, a fictitious value
3
where V c in these relations is in cm /mol. Constants a 1 – f 1 of d 20 was obtained through the extrapolation of density val-
and a 2 – f 2 in these relations are given in Table 2.9. These cor- ues at lower temperature given by Reid et al. [4]. The values
relations are recommended for hydrocarbons and petroleum of d 20 for some gases found in this manner are as follows:
fractions in the carbon number range of C 20 –C 50 . Although ammonia, NH 3 (0.61); nitrous oxide, N 2 O (0.79); methane,
these equations may be used to predict physical properties C 1 (0.18); ethane, C 2 (0.343); propane, C 3 (0.5); n-butane, nC 4
of hydrocarbons in the range of C 6 –C 20 , if the system does (0.579); isobutane, iC 4 (0.557); nitrogen, N 2 (0.135); oxygen,
not contain heavy hydrocarbons Eqs. (2.38) and (2.40) are O 2 (0.22); hydrogen sulfide, H 2 S (0.829); and hydrogen chlo-
recommended. ride, HCl (0.837). In some references different values for liq-
uid densities of some of these compounds have been reported.
3
For example, a value of 0.809 g/cm is reported as the den-
2.3.4 Extension of Proposed Correlations ◦
to Nonhydrocarbon Systems sity of N 2 at 15.5 C and 1 atm by several authors in reservoir
engineering [48, 51]. This value is very close to the density of
Equations (2.38) and (2.40) cannot be applied to systems con- N 2 at 78 K [4]. The critical temperature of N 2 is 126.1 K and
taining hydrocarbons, such as methane and ethane, or hydro-
gen sulfide. These equations are useful for hydrocarbons with --`,```,`,``````,`,````,```,,-`-`,,`,,`,`,,`---
carbon numbers above C 5 and are not applicable to natural TABLE 2.10—Constants for Eq. (2.47).
V c,
gases or refinery gases. Estimation of the properties of nonhy- θ → T c, K P c, MPa cm /g
3
Constants
drocarbon systems is beyond the objective of this book. But a 1.60193 10.74145 −8.84800
in reservoir fluids, compounds such as light hydrocarbons b 0.00558 0.07434 −0.03632
or H 2 S and CO 2 may be present. To develop a generalized c −0.00112 −0.00047 −0.00547
correlation in the form of Eq. (2.40) that includes nonhydro- d −0.52398 −2.10482 0.16629
0.00508
0.00104
carbons, usually a third parameter is needed to consider the e f −0.06403 −1.18869 −0.00028
0.04660
effects of polarity. In fact Vetere [66] has defined a polarity g 0.93857 −0.66773 2.00241
factor in terms of the molecular weight and boiling point to h −0.00085 −0.01154 0.00587
predict properties of polar compounds. Equation (2.40) was i 0.28290 1.53161 −0.96608
Copyright ASTM International
Provided by IHS Markit under license with ASTM Licensee=International Dealers Demo/2222333001, User=Anggiansah, Erick
No reproduction or networking permitted without license from IHS Not for Resale, 08/26/2021 21:56:35 MDT