
Page 208 - Chemical Process Equipment - Selection and Design
P. 208
180 HEAT TRANSFER AND HEAT EXCHANGERS
EXAMPLE 8.4 tabulation:
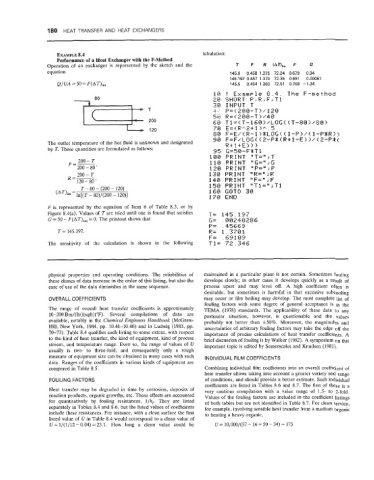
Performance of a Heat Exchanger with the F-Method
Operation of an exchanger is represented by the sketch and the T P R (An,,,, F G
equation 145.0 0.458 1.375 72.24 0.679 0.94
145.197 0.457 1.370 72.35 0.691 0.00061
Q/UA = 50 = F(AT),, 145.5 0.454 1.363 72.51 0.708 -1.34
le ! Examp le 8.4. The F-niett-rod
.-. -
rlLt SHORT P c R > F .* T 1
38 INPIJT T
.) "1 P= < 20a-T > ~'120
50 R=<28@-TjH4#
68 TI=( T- 16Bj.~LllI;( (T-Y#)/8@)
Ll_tz 2oo 120 7EI E=<R"..2+1 jA.5
:3 8 F=E,(R-l :!SLOG< < l-Pj,*c l-PSR>)
sa F=Fx'LOG < < 2-PB <R+ 1-E 3 1, (Z-PXI
The outlet temperature of the hot fluid is unknown and designated R + 1 +E 2 >
:J
by T. These quantities are formulated as follows: 35 G=5@-F$T1
188 PRIHT "T=" i T
p=- 200 - T 110 PRINT "I;=" j G
200 - 80 ' 120 PRINT "P=" ; P
Rs- 200- T 130 PRINT "R=" ;R
120-80' 140 PRINT "F=".;F
I' T 1 =I1 ; T 1
158 PI?: I t4T
T - 80 - (200 - 120) 168 GOTO 3B
(AT)lm=ln[(T - 80)/(200 - 120)] 170 EblD
F is represented by the equation of Item 6 of Table 8.3, or by
Figure 8.4(a). Values of T are tried until one is found that satisfies T= 145.197
G = 50 - F(AT),, = 0. The printout shows that I;= ,88249286
P= .45669
T = 145.197. R= 1.3701
F= ,69189
The sensitivity of the calculation is shown in the following Tl= 72.346
physical properties and operating conditions. The reliabilities of maintained in a particular plant is not certain. Sometimes fouling
these classes of data increase in the order of this listing, but also the develops slowly; in other cases it develops quickly as a result of
ease of use of the data diminishes in the same sequence. process upset and may level off. A high coefficient often is
desirable, but sometimes is harmful in that excessive subcooling
OVERALL COEFFICIENTS may occur or film boiling may develop. The most complete list of
fouling factors with some degree of general acceptance is in the
The range of overall heat transfer coefficients is approximately TEMA (1978) standards. The applicability of these data to any
10-200 Btu/(hr)(sqft)("F). Several compilations of data are particular situation, however, is questionable and the values
available, notably in the Chemical Engineers Handbook (McGraw- probably not better than *50%. Moreover, the magnitudes and
Hill, New York, 1984, pp. 10.41-10.46) and in Ludwig (1983, pp. uncertainties of arbitrary fouling factors may take the edge off the
70-73). Table 8.4 qualifies each listing to some extent, with respect importance of precise calculations of heat transfer coefficients. A
to the kind of heat transfer, the kind of equipment, kind of process brief discussion of fouling is by Walker (1982). A symposium on this
stream, and temperature range. Even so, the range of values of U important topic is edited by Somerscales and Knudsen (1981).
usually is two- to three-fold, and consequently only a rough
measure of equipment size can be obtained in many cases with such INDIVIDUAL FILM COEFFICIENTS
data. Ranges of the coefficients in various kinds of equipment are
compared in Table 8.5. Combining individual film coefficients into an overall coefficient of
heat transfer allows taking into account a greater variety and range
FOULING FACTORS of conditions, and should provide a better estimate. Such individual
coefficients are listed in Tables 8.6 and 8.7. The first of these is a
Heat transfer may be degraded in time by corrosion, deposits of very cautious compilation with a value range of 1.5- to 2-fold.
reaction products, organic growths, etc. These effects are accounted Values of the fouling factors are included in the coefficient listings
for quantitatively by fouling resistances, l/hf. They are listed of both tables but are not identified in Table 8.7. For clean service,
separately in Tables 8.4 and 8.6, but the listed values of coefficients for example, involving sensible heat transfer from a medium organic
include these resistances. For instance, with a clean surface the first to heating a heavy organic,
listed value of U in Table 8.4 would correspond to a clean value of
U = 1/(1/12 - 0.04) = 23.1. How long a clean value could be U = 10,000/(57 - 16 + 50 - 34) = 175