
Page 133 - Chemical engineering design
P. 133
113
FUNDAMENTALS OF ENERGY BALANCES
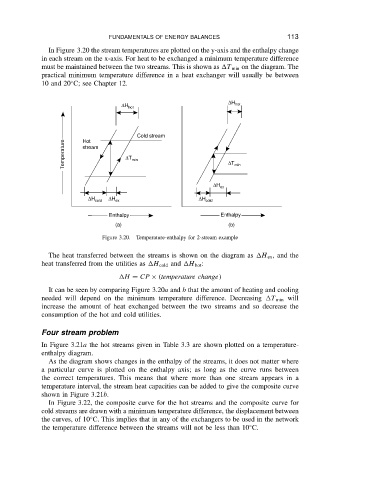
In Figure 3.20 the stream temperatures are plotted on the y-axis and the enthalpy change
in each stream on the x-axis. For heat to be exchanged a minimum temperature difference
must be maintained between the two streams. This is shown as T min on the diagram. The
practical minimum temperature difference in a heat exchanger will usually be between
Ž
10 and 20 C; see Chapter 12.
∆H
∆H hot hot
Cold stream
Hot
Temperature stream ∆T min ∆T min
∆H ex
∆H cold ∆H ex ∆H cold
Enthalpy Enthalpy
(a) (b)
Figure 3.20. Temperature-enthalpy for 2-stream example
The heat transferred between the streams is shown on the diagram as H ex ,and the
heat transferred from the utilities as H cold and H hot :
H D CP ð temperature change
It can be seen by comparing Figure 3.20a and b that the amount of heating and cooling
needed will depend on the minimum temperature difference. Decreasing T min will
increase the amount of heat exchanged between the two streams and so decrease the
consumption of the hot and cold utilities.
Four stream problem
In Figure 3.21a the hot streams given in Table 3.3 are shown plotted on a temperature-
enthalpy diagram.
As the diagram shows changes in the enthalpy of the streams, it does not matter where
a particular curve is plotted on the enthalpy axis; as long as the curve runs between
the correct temperatures. This means that where more than one stream appears in a
temperature interval, the stream heat capacities can be added to give the composite curve
shown in Figure 3.21b.
In Figure 3.22, the composite curve for the hot streams and the composite curve for
cold streams are drawn with a minimum temperature difference, the displacement between
Ž
the curves, of 10 C. This implies that in any of the exchangers to be used in the network
Ž
the temperature difference between the streams will not be less than 10 C.