
Page 137 - Chemical engineering design
P. 137
FUNDAMENTALS OF ENERGY BALANCES
of a negative value in the column indicates that the temperature gradient is in the wrong
direction and that the exchange is not thermodynamically possible. 117
This difficulty can be overcome if heat is introduced into the top of the cascade:
6. Introduce just enough heat to the top of the cascade to eliminate all the negative
values; see Figure 3.23b.
Comparing the composite curve, Figure 3.22, with Figure 3.23b shows that the heat
introduced to the cascade is the minimum hot utility requirement and the heat removed at
the bottom is the minimum cold utility required. The pinch occurs in Figure 3.23b where
the heat flow in the cascade is zero. This is as would be expected from the rule that for
minimum utility requirements no heat flows across the pinch. In Figure 3.23b the pinch
Ž
temperatures are 80 and 90 C, as was found using the composite stream curves.
It is not necessary to draw up a separate cascade diagram. This was done in Figure 3.23
to illustrate the principle. The cascaded values can be added to the problem table as two
additional columns; see example 3.16.
Summary
For maximum heat recovery and minimum use of utilities:
1. Do not transfer heat across the pinch
2. Do not use hot utilities below the pinch
3. Do not use cold utilities above the pinch
3.17.3. The heat exchanger network
Grid representation
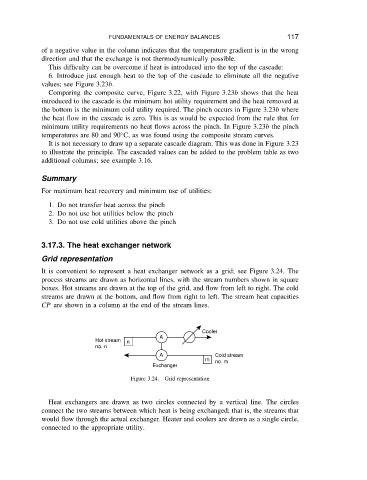
It is convenient to represent a heat exchanger network as a grid; see Figure 3.24. The
process streams are drawn as horizontal lines, with the stream numbers shown in square
boxes. Hot streams are drawn at the top of the grid, and flow from left to right. The cold
streams are drawn at the bottom, and flow from right to left. The stream heat capacities
CP are shown in a column at the end of the stream lines.
Cooler
A
Hot stream n
no. n
A Cold stream
m no. m
Exchanger
Figure 3.24. Grid representation
Heat exchangers are drawn as two circles connected by a vertical line. The circles
connect the two streams between which heat is being exchanged; that is, the streams that
would flow through the actual exchanger. Heater and coolers are drawn as a single circle,
connected to the appropriate utility.