
Page 206 - Chemical engineering design
P. 206
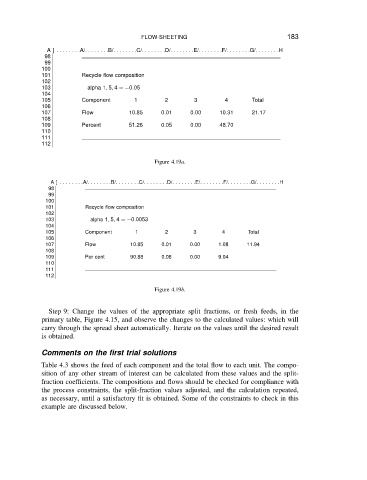
A] ... .. .. .A/... .. .. .B/... .. .. .C/.. .. ... .D/. .. ... ..E/... ... ..F/.. .. ... .G/.. .. .. ..H
                    98                          FLOW-SHEETING                             183
                    99
                   100
                   101         Recycle flow composition
                   102
                   103          alpha 1, 5, 4 D 0.05
                   104
                   105         Component      1        2       3        4       Total
                   106
                   107         Flow         10.85     0.01    0.00     10.31    21.17
                   108
                   109         Percent      51.26     0.05    0.00     48.70
                   110
                   111
                   112

                                                    Figure 4.19a.

                      A] .. .. .. . .A/... .. .. .B/.. ... .. .C/.. ... .. .D/.. .. ... .E/.. .. .. ..F/. ... .. ..G/.... .. ..H
                     98
                     99
                    100
                    101         Recycle flow composition
                    102
                    103          alpha 1, 5, 4 D 0.0053
                    104
                    105         Component     1        2       3       4       Total
                    106
                    107         Flow         10.85    0.01    0.00    1.08    11.94
                    108
                    109         Per cent     90.88    0.08    0.00    9.04
                    110
                    111
                    112

                                                    Figure 4.19b.

                     Step 9: Change the values of the appropriate split fractions, or fresh feeds, in the
                   primary table, Figure 4.15, and observe the changes to the calculated values: which will
                   carry through the spread sheet automatically. Iterate on the values until the desired result
                   is obtained.

                   Comments on the first trial solutions
                   Table 4.3 shows the feed of each component and the total flow to each unit. The compo-
                   sition of any other stream of interest can be calculated from these values and the split-
                   fraction coefficients. The compositions and flows should be checked for compliance with
                   the process constraints, the split-fraction values adjusted, and the calculation repeated,
                   as necessary, until a satisfactory fit is obtained. Some of the constraints to check in this
                   example are discussed below.