
Page 103 - Chemical equilibria Volume 4
P. 103
3.3.2.5. Effects of changes of state of a component of the reaction in
a metal–oxide Ellingham diagram Molecular Chemical Equilibria 79
The slope of the Ellingham line is modified when one of the components
of the reaction undergoes a change of physical state at a certain temperature,
in the wake of the entropy accompanying that change of state. We know that
the entropy of state change is positive in transformations from the solid state
to the liquid state and from the liquid state to the gaseous state, meaning
when the degree of order decreases.
If a component on the left-hand side of the reaction – say, aluminum in
reaction [3R.12] – undergoes fusion or volatilization, the standard entropy of
the reaction is decreased by the entropy of state change, and therefore there
is a break in the slope of the Ellingham line ( Δ s− 0 ), which sharply
r
increases at the state-change temperature.
On the other hand, if a component on the right-hand side of the reaction
undergoes fusion or volatilization, the standard entropy of the reaction is
increased by the entropy of state change, and thus the slope of the Ellingham
line ( Δ s− r 0 ) lessens.
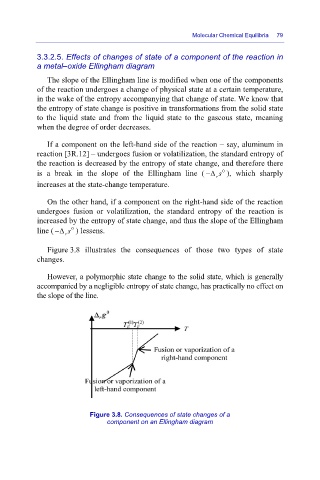
Figure 3.8 illustrates the consequences of those two types of state
changes.
However, a polymorphic state change to the solid state, which is generally
accompanied by a negligible entropy of state change, has practically no effect on
the slope of the line.
Figure 3.8. Consequences of state changes of a
component on an Ellingham diagram