
Page 99 - Chemical equilibria Volume 4
P. 99
Molecular Chemical Equilibria 75
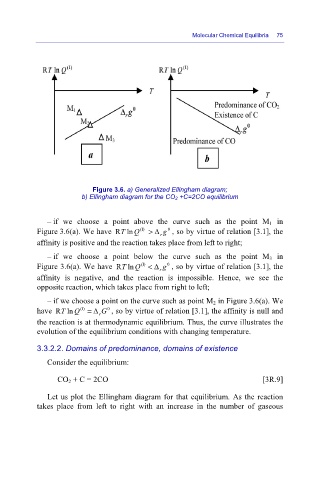
Figure 3.6. a) Generalized Ellingham diagram;
b) Ellingham diagram for the CO 2 +C=2CO equilibrium
– if we choose a point above the curve such as the point M 1 in
Figure 3.6(a). We have RlnT Q (I) > Δ g , so by virtue of relation [3.1], the
0
r
affinity is positive and the reaction takes place from left to right;
– if we choose a point below the curve such as the point M 3 in
(I)
0
Figure 3.6(a). We have RlnT Q < Δ g , so by virtue of relation [3.1], the
r
affinity is negative, and the reaction is impossible. Hence, we see the
opposite reaction, which takes place from right to left;
– if we choose a point on the curve such as point M 2 in Figure 3.6(a). We
0
have RlnT Q (I) = Δ G , so by virtue of relation [3.1], the affinity is null and
r
the reaction is at thermodynamic equilibrium. Thus, the curve illustrates the
evolution of the equilibrium conditions with changing temperature.
3.3.2.2. Domains of predominance, domains of existence
Consider the equilibrium:
CO 2 + C = 2CO [3R.9]
Let us plot the Ellingham diagram for that equilibrium. As the reaction
takes place from left to right with an increase in the number of gaseous