
Page 96 - Chemical equilibria Volume 4
P. 96
72 Chemical Equilibria
Thus, the slope of line PP’ becomes:
a =− T t [3.45]
This result confirms our statement.
A
(T) P -Δ rh 0
I
(T’)
I’ -Δ rh’ 0
P’
E’ E
0 (I) Rln
0
Δ rs Δ rs’ 0 RlnK
Rln
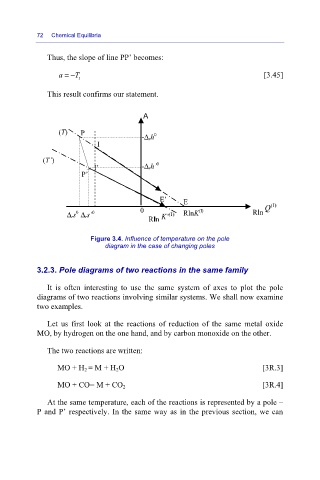
Figure 3.4. Influence of temperature on the pole
diagram in the case of changing poles
3.2.3. Pole diagrams of two reactions in the same family
It is often interesting to use the same system of axes to plot the pole
diagrams of two reactions involving similar systems. We shall now examine
two examples.
Let us first look at the reactions of reduction of the same metal oxide
MO, by hydrogen on the one hand, and by carbon monoxide on the other.
The two reactions are written:
MO + H 2 = M + H 2O [3R.3]
MO + CO= M + CO 2 [3R.4]
At the same temperature, each of the reactions is represented by a pole –
P and P’ respectively. In the same way as in the previous section, we can