
Page 98 - Chemical equilibria Volume 4
P. 98
74 Chemical Equilibria
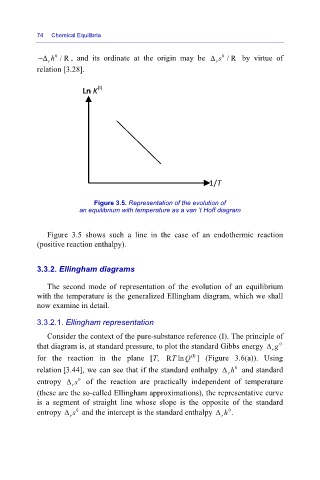
−
0
/R , and its ordinate at the origin may be Δ s
Δ h
r
relation [3.28]. r 0 /R by virtue of
Ln K (I)
1/T
Figure 3.5. Representation of the evolution of
an equilibrium with temperature as a van ’t Hoff diagram
Figure 3.5 shows such a line in the case of an endothermic reaction
(positive reaction enthalpy).
3.3.2. Ellingham diagrams
The second mode of representation of the evolution of an equilibrium
with the temperature is the generalized Ellingham diagram, which we shall
now examine in detail.
3.3.2.1. Ellingham representation
Consider the context of the pure-substance reference (I). The principle of
that diagram is, at standard pressure, to plot the standard Gibbs energy Δ g
0
r
(I)
for the reaction in the plane [T, RlnT Q ] (Figure 3.6(a)). Using
relation [3.44], we can see that if the standard enthalpy Δ h and standard
0
r
0
entropy Δ s of the reaction are practically independent of temperature
r
(these are the so-called Ellingham approximations), the representative curve
is a segment of straight line whose slope is the opposite of the standard
0
0
.
entropy Δ s and the intercept is the standard enthalpy Δ h
r r