
Page 52 - Chemical process engineering design and economics
P. 52
38 Chapter 2
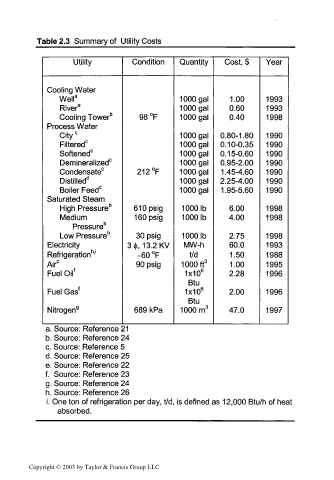
Table 2.3 Summary of Utility Costs
Utility Condition Quantity Cost, $ Year
Cooling Water
Well 3 1000 gal 1.00 1993
River 3 1000 gal 0.60 1993
Cooling Tower b 98 °F 1000 gal 0.40 1998
Process Water
City 0 1000 gal 0.80-1.80 1990
Filtered 0 1000 gal 0.10-0.35 1990
Softened 0 1000 gal 0.15-0.60 1990
Demineralized 0 1000 gal 0.95-2.00 1990
Condensate 0 212°F 1000 gal 1 .45-4.60 1990
Distilled" 1000 gal 2.25-4.00 1990
Boiler Feed 0 1000 gal 1 .95-5.60 1990
Saturated Steam
1
High Pressure " 610psig 1000lb 6.00 1998
Medium 160psig 1000lb 4.00 1998
Pressure 6
Low Pressure 6 30 psig 1000lb 2.75 1998
Electricity 3c(., 13.2KV MW-h 60.0 1993
6 1
Refrigeration ' -60 °F t/d 1.50 1988
Air c 90 psig 1000ft 3 1.00 1995
Fuel Oil f 1x10 6 2.28 1996
Btu
Fuel Gas f 1x10 6 2.00 1996
Btu
Nitrogen 9 689 kPa 1000m 3 47.0 1997
a. Source: Reference 21
b. Source: Reference 24
c. Source: Reference 5
d. Source: Reference 25
e. Source: Reference 22
f. Source: Reference 23
g. Source: Reference 24
h. Source: Reference 26
i. One ton of refrigeration per day, t/d, is defined as 12,000 Btu/h of heat
absorbed.
Copyright © 2003 by Taylor & Francis Group LLC