
Page 80 - Chemical process engineering design and economics
P. 80
Production and Capital Cost Estimation 65
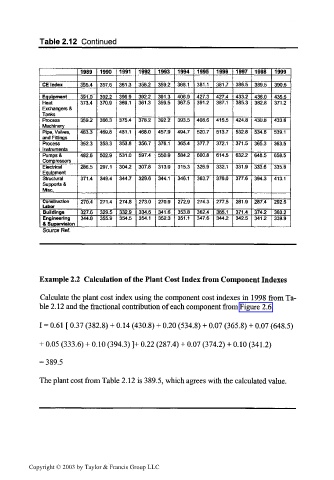
Table 2.12 Continued
1989 1990 1991 1992 1993 1994 1995 1 996 1997 1998 1999
CE Index 355.4 357.6 361.3 358.2 359.2 368.1 381.1 381.7 386.5 389.5 390.6
Equipment 391.0 392.2 396.9 392.2 391.3 406.9 427.3 427.4 433.2 436.0 435.5
Heat 373.4 370.9 369.1 361.3 359.5 367.5 391.2 387.1 385.3 382.8 371.2
Exchangers &
Tanks
Process 359.2 366.3 375.4 378.2 392.2 393.5 408.6 415.5 424.8 430.8 433.6
Machinery
Pipe. Valves, 463.3 469.8 481.1 468.0 457.9 494.7 520.7 513.7 532.8 534.8 539.1
and Fittings
Process 352.3 353.3 353.8 356.7 376.1 365.4 377.7 372.1 371.5 365.3 363.5
Instruments
Pumps & 482.6 502.9 531.0 597.4 550.9 584.2 600.8 614.5 632.2 648.5 658.5
Compressors
Electrical 286.5 297.1 304.2 307.8 313.0 315.3 326.9 332.1 331.9 333.6 335.8
Equipment
Structural 371.4 349.4 344.7 329.6 344.1 346.1 363.7 376.0 377.6 394.3 413.1
Supports &
Misc.
Construction 270.4 271.4 274.8 273.0 270.9 272.9 274.3 277.5 281.9 287.4 292.5
Labor
Buildings 327.6 329.5 332.9 334.6 341.6 353.8 362.4 365.1 371.4 3742 380.2
Engineering 344.8 355.9 354.5 354.1 352.3 351.1 347.6 344.2 342.5 341.2 339.9
& Supervision
Source Ref.
Example 2.2 Calculation of the Plant Cost Index from Component Indexes
Calculate the plant cost index using the component cost indexes in 1998 from Ta-
ble 2.12 and the fractional contribution of each component from Figure 2.6.
I = 0.61 [ 0.37 (382.8) + 0.14 (430.8) + 0.20 (534.8) + 0.07 (365.8) + 0.07 (648.5)
+ 0.05 (333.6) + 0.10 (394.3) ]+ 0.22 (287.4) + 0.07 (374.2) + 0.10 (341.2)
= 389.5
The plant cost from Table 2.12 is 389.5, which agrees with the calculated value.
Copyright © 2003 by Taylor & Francis Group LLC