
Page 158 - Chiral Separation Techniques
P. 158
136 5 Membranes in Chiral Separations
Several selective interactions by MIP membrane systems have been reported. For
example, an L-phenylalanine imprinted membrane prepared by in-situ crosslinking
polymerization showed different fluxes for various amino acids [44]. Yoshikawa et
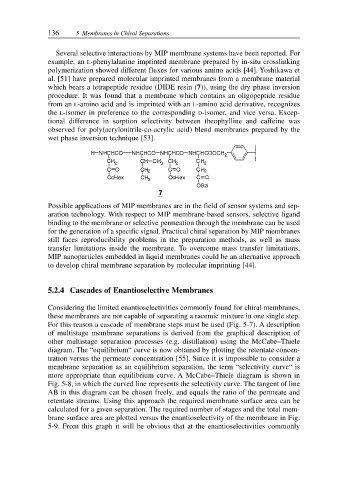
al. [51] have prepared molecular imprinted membranes from a membrane material
which bears a tetrapeptide residue (DIDE resin (7)), using the dry phase inversion
procedure. It was found that a membrane which contains an oligopeptide residue
from an L-amino acid and is imprinted with an L-amino acid derivative, recognizes
the L-isomer in preference to the corresponding D-isomer, and vice versa. Excep-
tional difference in sorption selectivity between theophylline and caffeine was
observed for poly(acrylonitrile-co-acrylic acid) blend membranes prepared by the
wet phase inversion technique [53].
Possible applications of MIP membranes are in the field of sensor systems and sep-
aration technology. With respect to MIP membrane-based sensors, selective ligand
binding to the membrane or selective permeation through the membrane can be used
for the generation of a specific signal. Practical chiral separation by MIP membranes
still faces reproducibility problems in the preparation methods, as well as mass
transfer limitations inside the membrane. To overcome mass transfer limitations,
MIP nanoparticles embedded in liquid membranes could be an alternative approach
to develop chiral membrane separation by molecular imprinting [44].
5.2.4 Cascades of Enantioselective Membranes
Considering the limited enantioselectivities commonly found for chiral membranes,
these membranes are not capable of separating a racemic mixture in one single step.
For this reason a cascade of membrane steps must be used (Fig. 5-7). A description
of multistage membrane separations is derived from the graphical description of
other multistage separation processes (e.g. distillation) using the McCabe–Thiele
diagram. The “equilibrium“ curve is now obtained by plotting the retentate concen-
tration versus the permeate concentration [55]. Since it is impossible to consider a
membrane separation as an equilibrium separation, the term “selectivity curve“ is
more appropriate than equilibrium curve. A McCabe–Thiele diagram is shown in
Fig. 5-8, in which the curved line represents the selectivity curve. The tangent of line
AB in this diagram can be chosen freely, and equals the ratio of the permeate and
retentate streams. Using this approach the required membrane surface area can be
calculated for a given separation. The required number of stages and the total mem-
brane surface area are plotted versus the enantioselectivity of the membrane in Fig.
5-9. From this graph it will be obvious that at the enantioselectivities commonly