
Page 235 - Chiral Separation Techniques
P. 235
8.5 Experimental Examples of Separations 213
–
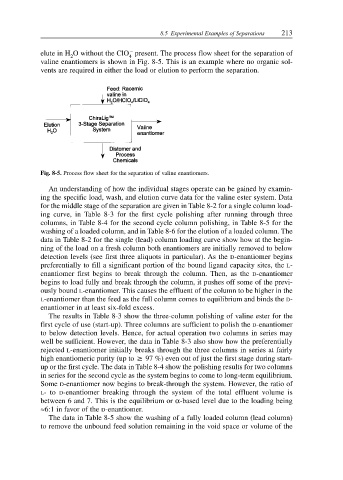
elute in H O without the ClO present. The process flow sheet for the separation of
2 4
valine enantiomers is shown in Fig. 8-5. This is an example where no organic sol-
vents are required in either the load or elution to perform the separation.
Fig. 8-5. Process flow sheet for the separation of valine enantiomers.
An understanding of how the individual stages operate can be gained by examin-
ing the specific load, wash, and elution curve data for the valine ester system. Data
for the middle stage of the separation are given in Table 8-2 for a single column load-
ing curve, in Table 8-3 for the first cycle polishing after running through three
columns, in Table 8-4 for the second cycle column polishing, in Table 8-5 for the
washing of a loaded column, and in Table 8-6 for the elution of a loaded column. The
data in Table 8-2 for the single (lead) column loading curve show how at the begin-
ning of the load on a fresh column both enantiomers are initially removed to below
detection levels (see first three aliquots in particular). As the D-enantiomer begins
preferentially to fill a significant portion of the bound ligand capacity sites, the L-
enantiomer first begins to break through the column. Then, as the D-enantiomer
begins to load fully and break through the column, it pushes off some of the previ-
ously bound L-enantiomer. This causes the effluent of the column to be higher in the
L-enantiomer than the feed as the full column comes to equilibrium and binds the D-
enantiomer in at least six-fold excess.
The results in Table 8-3 show the three-column polishing of valine ester for the
first cycle of use (start-up). Three columns are sufficient to polish the D-enantiomer
to below detection levels. Hence, for actual operation two columns in series may
well be sufficient. However, the data in Table 8-3 also show how the preferentially
rejected L-enantiomer initially breaks through the three columns in series at fairly
high enantiomeric purity (up to 6 97 %) even out of just the first stage during start-
up or the first cycle. The data in Table 8-4 show the polishing results for two columns
in series for the second cycle as the system begins to come to long-term equilibrium.
Some D-enantiomer now begins to break-through the system. However, the ratio of
L- to D-enantiomer breaking through the system of the total effluent volume is
between 6 and 7. This is the equilibrium or α-based level due to the loading being
≈6:1 in favor of the D-enantiomer.
The data in Table 8-5 show the washing of a fully loaded column (lead column)
to remove the unbound feed solution remaining in the void space or volume of the