
Page 291 - Chiral Separation Techniques
P. 291
270 10 The Use of SMB for the Manufacture of Enantiopure Drug Substances: From …
Correlation between experimental and calculated concentrations is obtained using
a modified Langmuir adsorption isotherm with the following parameters:
.
λ = 0 738 N = 120
.
K ˜ = 0 0113 K ˜ = 0 02
.
A B
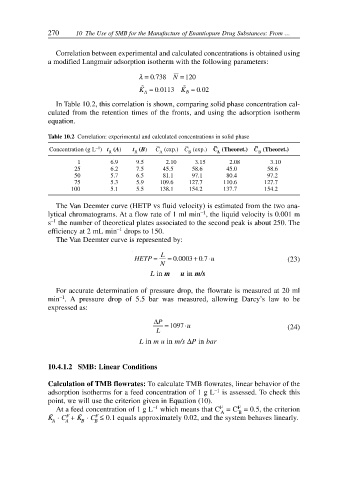
In Table 10.2, this correlation is shown, comparing solid phase concentration cal-
culated from the retention times of the fronts, and using the adsorption isotherm
equation.
Table 10.2 Correlation: experimental and calculated concentrations in solid phase
– – – –
–1
Concentration (g L ) t (A) t (B) C (exp.) C (exp.) C (Theoret.) C (Theoret.)
R R A B A B
1 6.9 9.5 2.10 3.15 2.08 3.10
25 6.2 7.5 45.5 58.6 45.0 58.6
50 5.7 6.5 81.1 97.1 80.4 97.2
75 5.3 5.9 109.6 127.7 110.6 127.7
100 5.1 5.5 138.1 154.2 137.7 154.2
The Van Deemter curve (HETP vs fluid velocity) is estimated from the two ana-
–1
lytical chromatograms. At a flow rate of 1 ml min , the liquid velocity is 0.001 m
–1
s the number of theoretical plates associated to the second peak is about 250. The
–1
efficiency at 2 mL min drops to 150.
The Van Deemter curve is represented by:
HETP = L = 0 0003 0. u ⋅ 7 (23)
+
.
N
L in m u in m/s
For accurate determination of pressure drop, the flowrate is measured at 20 ml
–1
min . A pressure drop of 5.5 bar was measured, allowing Darcy’s law to be
expressed as:
∆P
= 1097 u ⋅ (24)
L
L in mu in m/s ∆P in bar
10.4.1.2 SMB: Linear Conditions
Calculation of TMB flowrates: To calculate TMB flowrates, linear behavior of the
adsorption isotherms for a feed concentration of 1 g L –1 is assessed. To check this
point, we will use the criterion given in Equation (10).
F
F
–1
At a feed concentration of 1 g L which means that C = C = 0.5, the criterion
A
B
˜
˜
F
F
K · C + K · C ≤ 0.1 equals approximately 0.02, and the system behaves linearly.
A A B B