
Page 164 - Compression Machinery for Oil and Gas
P. 164
152 SECTION II Types of Equipment
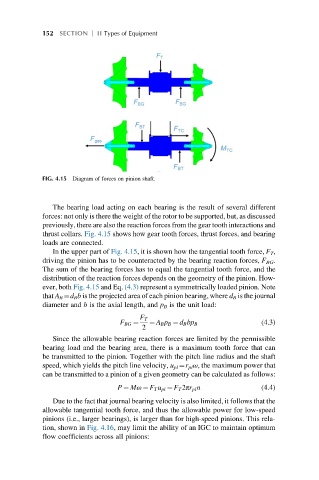
FIG. 4.15 Diagram of forces on pinion shaft.
The bearing load acting on each bearing is the result of several different
forces: not only is there the weight of the rotor to be supported, but, as discussed
previously, there are also the reaction forces from the gear tooth interactions and
thrust collars. Fig. 4.15 shows how gear tooth forces, thrust forces, and bearing
loads are connected.
In the upper part of Fig. 4.15, it is shown how the tangential tooth force, F T ,
driving the pinion has to be counteracted by the bearing reaction forces, F BG .
The sum of the bearing forces has to equal the tangential tooth force, and the
distribution of the reaction forces depends on the geometry of the pinion. How-
ever, both Fig. 4.15 and Eq. (4.3) represent a symmetrically loaded pinion. Note
that A B ¼d B b is the projected area of each pinion bearing, where d B is the journal
diameter and b is the axial length, and p B is the unit load:
F T
F BG ¼ ¼ A B p B ¼ d B bp B (4.3)
2
Since the allowable bearing reaction forces are limited by the permissible
bearing load and the bearing area, there is a maximum tooth force that can
be transmitted to the pinion. Together with the pitch line radius and the shaft
speed, which yields the pitch line velocity, u pl ¼r pl ω, the maximum power that
can be transmitted to a pinion of a given geometry can be calculated as follows:
P ¼ Mω ¼ F T u pl ¼ F T 2πr pl n (4.4)
Due to the fact that journal bearing velocity is also limited, it follows that the
allowable tangential tooth force, and thus the allowable power for low-speed
pinions (i.e., larger bearings), is larger than for high-speed pinions. This rela-
tion, shown in Fig. 4.16, may limit the ability of an IGC to maintain optimum
flow coefficients across all pinions: