
Page 152 - Computational Colour Science Using MATLAB
P. 152
IMPLEMENTATIONS AND EXAMPLES 139
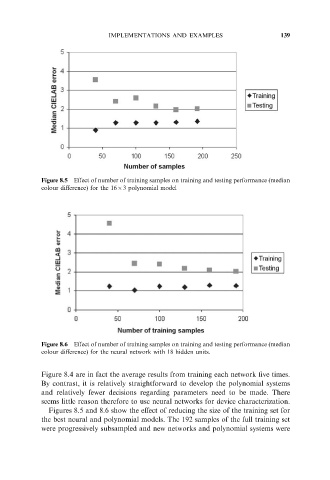
Figure 8.5 Effect of number of training samples on training and testing performance (median
colour difference) for the 1663 polynomial model
Figure 8.6 Effect of number of training samples on training and testing performance (median
colour difference) for the neural network with 18 hidden units.
Figure 8.4 are in fact the average results from training each network five times.
By contrast, it is relatively straightforward to develop the polynomial systems
and relatively fewer decisions regarding parameters need to be made. There
seems little reason therefore to use neural networks for device characterization.
Figures 8.5 and 8.6 show the effect of reducing the size of the training set for
the best neural and polynomial models. The 192 samples of the full training set
were progressively subsampled and new networks and polynomial systems were