
Page 270 - Computational Fluid Dynamics for Engineers
P. 270
260 8. Stability and Transition
0.050
0.040
<° 0.030
0.020
a, = 0.0
0.010
0.0 0.5 1.0 1.5 2.0
x(ft)
(b)
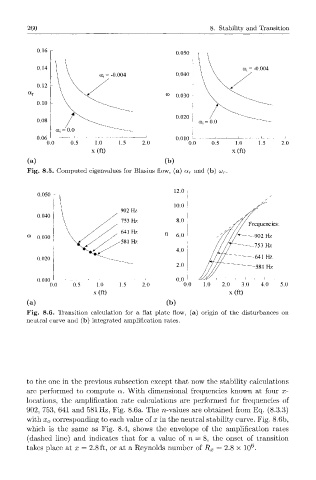
Fig. 8.5. Computed eigenvalues for Blasius flow, (a) a r and (b) uo r
12.0
0.050 r
10.0
902 Hz
0.040
753 Hz 8.0
641 Hz
03 n 6.0
0.030
581 Hz
4.0
0.020
2.0
0.010
0.0 0.5 1.0 1.5 2.0
x(ft)
(a)
Fig. 8.6. Transition calculation for a flat plate flow, (a) origin of the disturbances on
neutral curve and (b) integrated amplification rates.
to the one in the previous subsection except that now the stability calculations
are performed to compute a. With dimensional frequencies known at four al-
locations, the amplification rate calculations are performed for frequencies of
902, 753, 641 and 581 Hz, Fig. 8.6a. The n-values are obtained from Eq. (8.3.3)
with x 0 corresponding to each value of x in the neutral stability curve. Fig. 8.6b,
which is the same as Fig. 8.4, shows the envelope of the amplification rates
(dashed line) and indicates that for a value of n — 8, the onset of transition
6
takes place at x — 2.8 ft, or at a Reynolds number of R x — 2.8 x 10 .