
Page 252 - Computational Retinal Image Analysis
P. 252
250 CHAPTER 13 Drusen and macular degeneration
domain optical coherence tomography (SD-OCT) imaging, moderate to intense hy-
perreflective foci within various layers of the retina correspond to foci of hyperpig-
mentation [31]. Nongeographic atrophy may immediately precede GA. Detachments
of the RPE may accompany the changes of AMD. Soft drusen (usually those larger
than 500 μm) accompanied by serous fluid are termed drusenoid PEDs. Drusenoid
PEDs have variable elevation but tend to be shallower than serous PEDs and have
less variable topography than fibrovascular PEDs (see below).
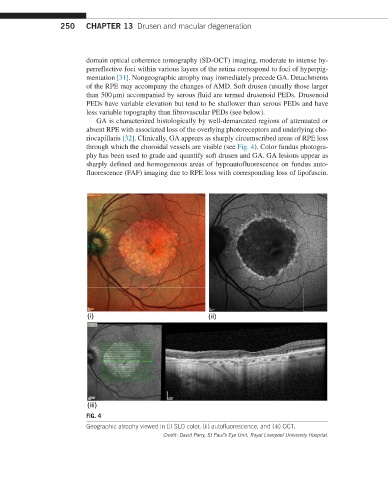
GA is characterized histologically by well-demarcated regions of attenuated or
absent RPE with associated loss of the overlying photoreceptors and underlying cho-
riocapillaris [32]. Clinically, GA appears as sharply circumscribed areas of RPE loss
through which the choroidal vessels are visible (see Fig. 4). Color fundus photogra-
phy has been used to grade and quantify soft drusen and GA. GA lesions appear as
sharply defined and homogeneous areas of hypoautofluorescence on fundus auto-
fluorescence (FAF) imaging due to RPE loss with corresponding loss of lipofuscin.
(i) (ii)
(iii)
FIG. 4
Geographic atrophy viewed in (i) SLO color, (ii) autofluorescence, and (iii) OCT.
Credit: David Parry, St Paul’s Eye Unit, Royal Liverpool University Hospital.