
Page 254 - Computational Retinal Image Analysis
P. 254
252 CHAPTER 13 Drusen and macular degeneration
(i)
(ii)
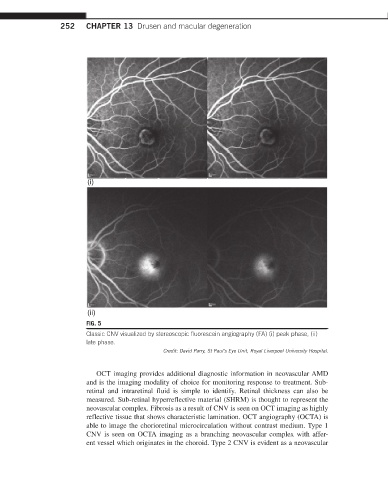
FIG. 5
Classic CNV visualized by stereoscopic fluorescein angiography (FA) (i) peak phase, (ii)
late phase.
Credit: David Parry, St Paul’s Eye Unit, Royal Liverpool University Hospital.
OCT imaging provides additional diagnostic information in neovascular AMD
and is the imaging modality of choice for monitoring response to treatment. Sub-
retinal and intraretinal fluid is simple to identify. Retinal thickness can also be
measured. Sub-retinal hyperreflective material (SHRM) is thought to represent the
neovascular complex. Fibrosis as a result of CNV is seen on OCT imaging as highly
reflective tissue that shows characteristic lamination. OCT angiography (OCTA) is
able to image the chorioretinal microcirculation without contrast medium. Type 1
CNV is seen on OCTA imaging as a branching neovascular complex with affer-
ent vessel which originates in the choroid. Type 2 CNV is evident as a neovascular