
Page 92 - Computational Retinal Image Analysis
P. 92
84 CHAPTER 5 Automatic landmark detection in fundus photography
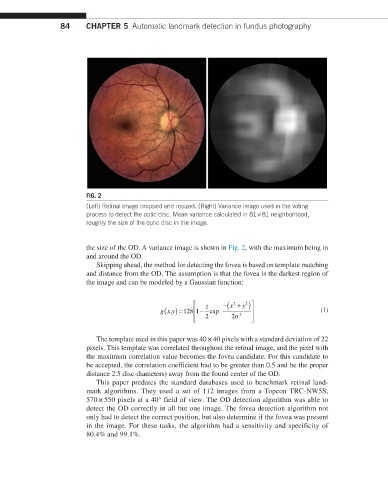
FIG. 2
(Left) Retinal image cropped and resized. (Right) Variance image used in the voting
process to detect the optic disc. Mean variance calculated in 81 × 81 neighborhood,
roughly the size of the optic disc in the image.
the size of the OD. A variance image is shown in Fig. 2, with the maximum being in
and around the OD.
Skipping ahead, the method for detecting the fovea is based on template matching
and distance from the OD. The assumption is that the fovea is the darkest region of
the image and can be modeled by a Gaussian function:
y
−( x + )
2
2
1
(
gx y) =128 1 − exp (1)
,
2 2σ 2
The template used in this paper was 40 × 40 pixels with a standard deviation of 22
pixels. This template was correlated throughout the retinal image, and the pixel with
the maximum correlation value becomes the fovea candidate. For this candidate to
be accepted, the correlation coefficient had to be greater than 0.5 and be the proper
distance 2.5 disc-diameters) away from the found center of the OD.
This paper predates the standard databases used to benchmark retinal land-
mark algorithms. They used a set of 112 images from a Topcon TRC-NW5S,
570 × 550 pixels at a 40° field of view. The OD detection algorithm was able to
detect the OD correctly in all but one image. The fovea detection algorithm not
only had to detect the correct position, but also determine if the fovea was present
in the image. For these tasks, the algorithm had a sensitivity and specificity of
80.4% and 99.1%.