
Page 95 - Computational Retinal Image Analysis
P. 95
5 Optic disc and fovea detection 87
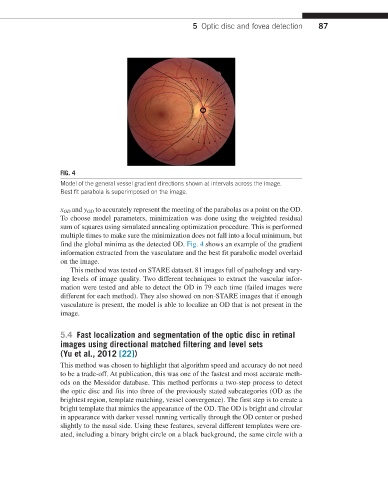
FIG. 4
Model of the general vessel gradient directions shown at intervals across the image.
Best fit parabola is superimposed on the image.
x OD and y OD to accurately represent the meeting of the parabolas as a point on the OD.
To choose model parameters, minimization was done using the weighted residual
sum of squares using simulated annealing optimization procedure. This is performed
multiple times to make sure the minimization does not fall into a local minimum, but
find the global minima as the detected OD. Fig. 4 shows an example of the gradient
information extracted from the vasculature and the best fit parabolic model overlaid
on the image.
This method was tested on STARE dataset. 81 images full of pathology and vary-
ing levels of image quality. Two different techniques to extract the vascular infor-
mation were tested and able to detect the OD in 79 each time (failed images were
different for each method). They also showed on non-STARE images that if enough
vasculature is present, the model is able to localize an OD that is not present in the
image.
5.4 Fast localization and segmentation of the optic disc in retinal
images using directional matched filtering and level sets
(Yu et al., 2012 [22])
This method was chosen to highlight that algorithm speed and accuracy do not need
to be a trade-off. At publication, this was one of the fastest and most accurate meth-
ods on the Messidor database. This method performs a two-step process to detect
the optic disc and fits into three of the previously stated subcategories (OD as the
brightest region, template matching, vessel convergence). The first step is to create a
bright template that mimics the appearance of the OD. The OD is bright and circular
in appearance with darker vessel running vertically through the OD center or pushed
slightly to the nasal side. Using these features, several different templates were cre-
ated, including a binary bright circle on a black background, the same circle with a