
Page 97 - Computational Retinal Image Analysis
P. 97
5 Optic disc and fovea detection 89
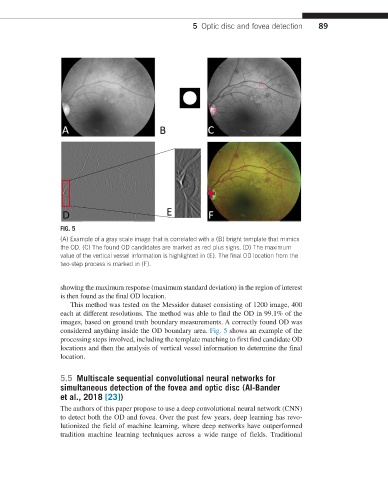
FIG. 5
(A) Example of a gray scale image that is correlated with a (B) bright template that mimics
the OD. (C) The found OD candidates are marked as red plus signs. (D) The maximum
value of the vertical vessel information is highlighted in (E). The final OD location from the
two-step process is marked in (F).
showing the maximum response (maximum standard deviation) in the region of interest
is then found as the final OD location.
This method was tested on the Messidor dataset consisting of 1200 image, 400
each at different resolutions. The method was able to find the OD in 99.1% of the
images, based on ground truth boundary measurements. A correctly found OD was
considered anything inside the OD boundary area. Fig. 5 shows an example of the
processing steps involved, including the template matching to first find candidate OD
locations and then the analysis of vertical vessel information to determine the final
location.
5.5 Multiscale sequential convolutional neural networks for
simultaneous detection of the fovea and optic disc (Al-Bander
et al., 2018 [23])
The authors of this paper propose to use a deep convolutional neural network (CNN)
to detect both the OD and fovea. Over the past few years, deep learning has revo-
lutionized the field of machine learning, where deep networks have outperformed
tradition machine learning techniques across a wide range of fields. Traditional