
Page 93 - Computational Retinal Image Analysis
P. 93
5 Optic disc and fovea detection 85
5.2 Locating the optic nerve in a retinal image using the fuzzy
convergence of the blood vessels (Hoover and Goldbaum,
2003 [11])
Another highly cited paper, this method was chosen because of its focus on diseased
retinas. Detecting the OD in a normal retina is often a straight forward task where
the simplest methods can achieve very high accuracy. This method performs well on
diseased retinas with sacrificing performance on normals. As the convergent point
of all the retinal vasculature, this method finds the OD as the densest area of vessel
endpoints based on fuzzy line geometry. The first step in this method is to perform
an arbitrary vessel segmentation. This segmentation is then skeletonized so that each
vessel is one pixel thick. Next, all branch and bifurcation pixels are removed from the
skeleton. This leaves vessel segments, each with its own unique start and end point.
From this point, the fuzzy segment model is employed on each vessel segment. A
fuzzy segment F, is defined as the family of line segments:
+ ) + (
α
xt () = x + rcos(αθ x − x − 2 rcoscos ) t (2)
θ
1
2
1
θ
y rsin(αθ
yt () =+ + ) + ( y − y − 2 rcossin ) t
α
2
1
Where (x 1 ,y 1 ) and (x 2 ,y 2 ) denote the start and end points of the line respectively and r
represents a radius around the endpoints for which the line is rotated and α is the starting
orientation of the line. As the line is rotated around the endpoints, all pixels that contact
this path become part of the set that defines F. The fuzzy segment ends up being thicker
on the ends compared to the central region of the segment. The key is to determine a
suitable radius, which essentially adds to the length of the segment and discretization’s
of θ and t to properly cover the pixels of interest for each segment. Each “on” pixel in the
fuzzy segment casts a single vote. Once this has been done for each segment in the image,
the votes are tallied, the vote map is blurred and a region of interest is determined through
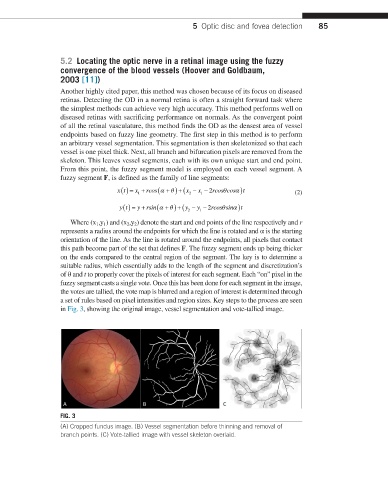
a set of rules based on pixel intensities and region sizes. Key steps to the process are seen
in Fig. 3, showing the original image, vessel segmentation and vote-tallied image.
FIG. 3
(A) Cropped fundus image. (B) Vessel segmentation before thinning and removal of
branch points. (C) Vote-tallied image with vessel skeleton overlaid.