
Page 182 - Computational Statistics Handbook with MATLAB
P. 182
Chapter 5: Exploratory Data Analysis 169
10
8
6
4
2
0
−2 0 2 4 6 8 10 12
F FI F F II U URE G 5.4 RE RE RE 5.4 3 3 3 3
5.4
5.4
GU
IG
GU
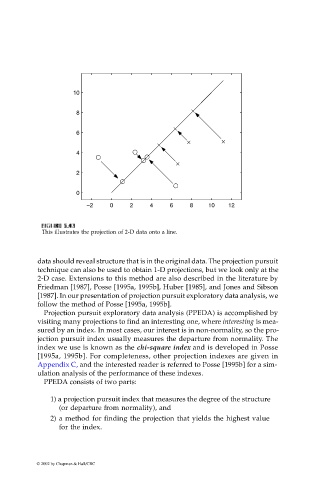
This illustrates the projection of 2-D data onto a line.
data should reveal structure that is in the original data. The projection pursuit
technique can also be used to obtain 1-D projections, but we look only at the
2-D case. Extensions to this method are also described in the literature by
Friedman [1987], Posse [1995a, 1995b], Huber [1985], and Jones and Sibson
[1987]. In our presentation of projection pursuit exploratory data analysis, we
follow the method of Posse [1995a, 1995b].
Projection pursuit exploratory data analysis (PPEDA) is accomplished by
visiting many projections to find an interesting one, where interesting is mea-
sured by an index. In most cases, our interest is in non-normality, so the pro-
jection pursuit index usually measures the departure from normality. The
index we use is known as the chi-square index and is developed in Posse
[1995a, 1995b]. For completeness, other projection indexes are given in
Appendix C, and the interested reader is referred to Posse [1995b] for a sim-
ulation analysis of the performance of these indexes.
PPEDA consists of two parts:
1) a projection pursuit index that measures the degree of the structure
(or departure from normality), and
2) a method for finding the projection that yields the highest value
for the index.
© 2002 by Chapman & Hall/CRC