
Page 180 - Computational Statistics Handbook with MATLAB
P. 180
Chapter 5: Exploratory Data Analysis 167
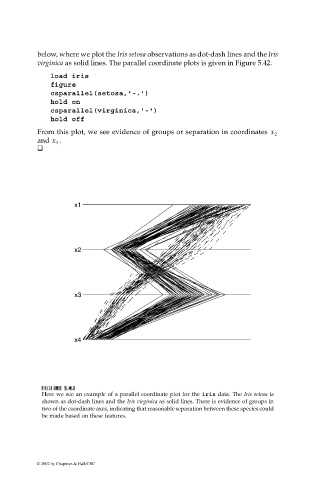
below, where we plot the Iris setosa observations as dot-dash lines and the Iris
virginica as solid lines. The parallel coordinate plots is given in Figure 5.42.
load iris
figure
csparallel(setosa,'-.')
hold on
csparallel(virginica,'-')
hold off
From this plot, we see evidence of groups or separation in coordinates x 2
.
and x 3
x1
x1
x2
x2
x3
x3
x4
x4
F FI U URE G 5.4 RE 5.4 2 2
IG
GU
F F II GU RE RE 5.4 2 2
5.4
Here we see an example of a parallel coordinate plot for the iris data. The Iris setosa is
shown as dot-dash lines and the Iris virginica as solid lines. There is evidence of groups in
two of the coordinate axes, indicating that reasonable separation between these species could
be made based on these features.
© 2002 by Chapman & Hall/CRC