Page 178 - Computational Statistics Handbook with MATLAB
P. 178

Chapter 5: Exploratory Data Analysis                            165
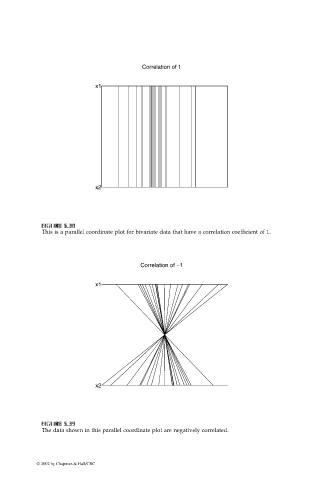


                                                          Correlation of 1

                                             x1


                                             x2


                                  5.3
                               GU
                               GU
                              F FI F F II U URE G 5.3  RE RE RE 5.3 8  8 8 8
                                  5.3
                               IG
                              This is a parallel coordinate plot for bivariate data that have a correlation coefficient of 1.
                                                         Correlation of −1
                                             x1


                                             x2


                                  5.3
                                  5.3
                               IG
                              F F FI F U URE G 5.3  RE RE RE 5.3 9  9 9 9
                               II
                               GU
                               GU
                              The data shown in this parallel coordinate plot are negatively correlated.
                            © 2002 by Chapman & Hall/CRC
   173   174   175   176   177   178   179   180   181   182   183