Page 231 - Computational Statistics Handbook with MATLAB
P. 231

218                        Computational Statistics Handbook with MATLAB


                                thetab = skewness(xboot);
                                seb = std(thetab);
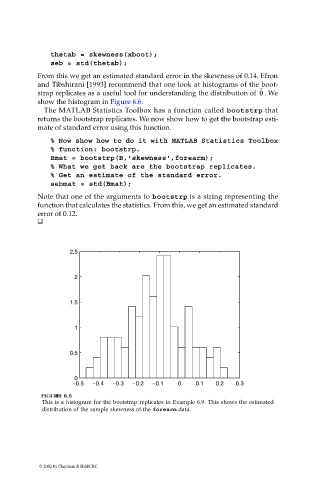
                             From this we get an estimated standard error in the skewness of 0.14. Efron
                             and Tibshirani [1993] recommend that one look at histograms of the boot-
                                                                                           ˆ
                                                                                           θ
                             strap replicates as a useful tool for understanding the distribution of  . We
                             show the histogram in Figure 6.6.
                              The MATLAB Statistics Toolbox has a function called bootstrp that
                             returns the bootstrap replicates. We now show how to get the bootstrap esti-
                             mate of standard error using this function.
                                % Now show how to do it with MATLAB Statistics Toolbox
                                % function: bootstrp.
                                Bmat = bootstrp(B,'skewness',forearm);
                                % What we get back are the bootstrap replicates.
                                % Get an estimate of the standard error.
                                sebmat = std(Bmat);
                             Note that one of the arguments to bootstrp is a string representing the
                             function that calculates the statistics. From this, we get an estimated standard
                             error of 0.12.


                                      2.5


                                       2


                                      1.5


                                       1


                                      0.5


                                       0
                                      −0.5  −0.4  −0.3  −0.2  −0.1  0    0.1  0.2   0.3

                               IG
                              F FI  U URE G 6.  RE 6. 6  6
                              F F II  GU  RE RE 6. 6.  6
                               GU
                                     6
                              This is a histogram for the bootstrap replicates in Example 6.9. This shows the estimated
                              distribution of the sample skewness of the forearm data.


                             © 2002 by Chapman & Hall/CRC
   226   227   228   229   230   231   232   233   234   235   236