Page 350 - Computational Statistics Handbook with MATLAB
P. 350

Chapter 9: Statistical Pattern Recognition                      339


                                     0.25

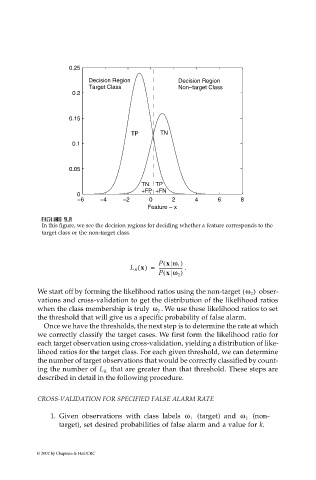
                                           Decision Region          Decision Region
                                           Target Class             Non−target Class
                                      0.2


                                     0.15

                                                       TP      TN
                                      0.1


                                     0.05

                                                          TN  TP
                                                          +FP  +FN
                                        0
                                        −6    −4    −2      0     2      4     6     8
                                                           Feature − x
                               U
                              FI F IG URE G 9.  RE 9. 8  8
                               GU
                                     8
                              F F II  GU  RE RE 9. 9.  8
                              In this figure, we see the decision regions for deciding whether a feature corresponds to the
                              target class or the non-target class.
                                                              P x ω 1 )
                                                                (
                                                      L R x() =  --------------------  .
                                                                (
                                                              P x ω 2 )
                             We start off by forming the likelihood ratios using the non-target  ω 2 )   obser-
                                                                                      (
                             vations and cross-validation to get the distribution of the likelihood ratios
                                                               . We use these likelihood ratios to set
                             when the class membership is truly  ω 2
                             the threshold that will give us a specific probability of false alarm.
                              Once we have the thresholds, the next step is to determine the rate at which
                             we correctly classify the target cases. We first form the likelihood ratio for
                             each target observation using cross-validation, yielding a distribution of like-
                             lihood ratios for the target class. For each given threshold, we can determine
                             the number of target observations that would be correctly classified by count-
                                                 that are greater than that threshold. These steps are
                             ing the number of  L R
                             described in detail in the following procedure.

                             CROSS-VALIDATION FOR SPECIFIED FALSE ALARM RATE

                                                                                          (non-
                                1. Given observations  with  class  labels  ω 1   (target) and  ω 2
                                   target), set desired probabilities of false alarm and a value for k.


                            © 2002 by Chapman & Hall/CRC
   345   346   347   348   349   350   351   352   353   354   355