
Page 127 -
P. 127
106 3 Image processing
(a) (b) (c) (d)
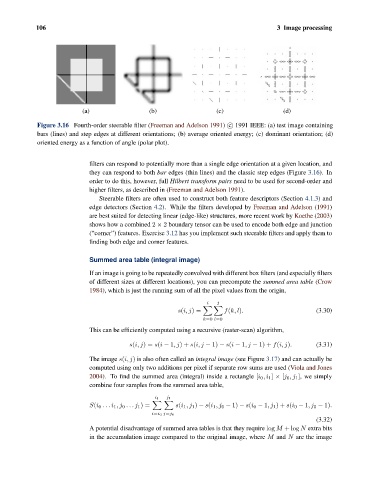
Figure 3.16 Fourth-order steerable filter (Freeman and Adelson 1991) c 1991 IEEE: (a) test image containing
bars (lines) and step edges at different orientations; (b) average oriented energy; (c) dominant orientation; (d)
oriented energy as a function of angle (polar plot).
filters can respond to potentially more than a single edge orientation at a given location, and
they can respond to both bar edges (thin lines) and the classic step edges (Figure 3.16). In
order to do this, however, full Hilbert transform pairs need to be used for second-order and
higher filters, as described in (Freeman and Adelson 1991).
Steerable filters are often used to construct both feature descriptors (Section 4.1.3) and
edge detectors (Section 4.2). While the filters developed by Freeman and Adelson (1991)
are best suited for detecting linear (edge-like) structures, more recent work by Koethe (2003)
shows how a combined 2 × 2 boundary tensor can be used to encode both edge and junction
(“corner”) features. Exercise 3.12 has you implement such steerable filters and apply them to
finding both edge and corner features.
Summed area table (integral image)
If an image is going to be repeatedly convolved with different box filters (and especially filters
of different sizes at different locations), you can precompute the summed area table (Crow
1984), which is just the running sum of all the pixel values from the origin,
i j
s(i, j)= f(k, l). (3.30)
k=0 l=0
This can be efficiently computed using a recursive (raster-scan) algorithm,
s(i, j)= s(i − 1,j)+ s(i, j − 1) − s(i − 1,j − 1) + f(i, j). (3.31)
The image s(i, j) is also often called an integral image (see Figure 3.17) and can actually be
computed using only two additions per pixel if separate row sums are used (Viola and Jones
2004). To find the summed area (integral) inside a rectangle [i 0 ,i 1 ] × [j 0 ,j 1 ], we simply
combine four samples from the summed area table,
i 1 j 1
S(i 0 ...i 1 ,j 0 ...j 1 )= s(i 1 ,j 1 ) − s(i 1 ,j 0 − 1) − s(i 0 − 1,j 1 )+ s(i 0 − 1,j 0 − 1).
i=i 0 j=j 0
(3.32)
A potential disadvantage of summed area tables is that they require log M + log N extra bits
in the accumulation image compared to the original image, where M and N are the image