
Page 147 -
P. 147
126 3 Image processing
1.00
0.75
0.50
0.25
0.00
0.00 0.25 0.50 0.75 1.00
-0.25
-0.50
-0.75
-1.00
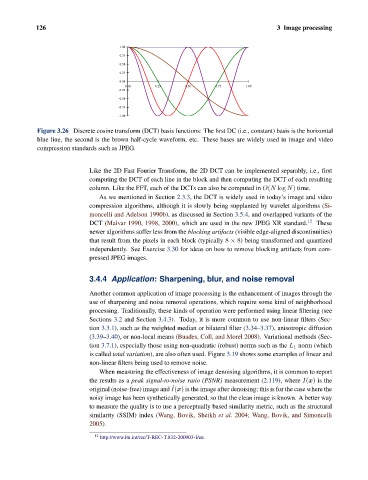
Figure 3.26 Discrete cosine transform (DCT) basis functions: The first DC (i.e., constant) basis is the horizontal
blue line, the second is the brown half-cycle waveform, etc. These bases are widely used in image and video
compression standards such as JPEG.
Like the 2D Fast Fourier Transform, the 2D DCT can be implemented separably, i.e., first
computing the DCT of each line in the block and then computing the DCT of each resulting
column. Like the FFT, each of the DCTs can also be computed in O(N log N) time.
As we mentioned in Section 2.3.3, the DCT is widely used in today’s image and video
compression algorithms, although it is slowly being supplanted by wavelet algorithms (Si-
moncelli and Adelson 1990b), as discussed in Section 3.5.4, and overlapped variants of the
DCT (Malvar 1990, 1998, 2000), which are used in the new JPEG XR standard. 12 These
newer algorithms suffer less from the blocking artifacts (visible edge-aligned discontinuities)
that result from the pixels in each block (typically 8 × 8) being transformed and quantized
independently. See Exercise 3.30 for ideas on how to remove blocking artifacts from com-
pressed JPEG images.
3.4.4 Application: Sharpening, blur, and noise removal
Another common application of image processing is the enhancement of images through the
use of sharpening and noise removal operations, which require some kind of neighborhood
processing. Traditionally, these kinds of operation were performed using linear filtering (see
Sections 3.2 and Section 3.4.3). Today, it is more common to use non-linear filters (Sec-
tion 3.3.1), such as the weighted median or bilateral filter (3.34–3.37), anisotropic diffusion
(3.39–3.40), or non-local means (Buades, Coll, and Morel 2008). Variational methods (Sec-
tion 3.7.1), especially those using non-quadratic (robust) norms such as the L 1 norm (which
is called total variation), are also often used. Figure 3.19 shows some examples of linear and
non-linear filters being used to remove noise.
When measuring the effectiveness of image denoising algorithms, it is common to report
the results as a peak signal-to-noise ratio (PSNR) measurement (2.119), where I(x) is the
ˆ
original (noise-free) image and I(x) is the image after denoising; this is for the case where the
noisy image has been synthetically generated, so that the clean image is known. A better way
to measure the quality is to use a perceptually based similarity metric, such as the structural
similarity (SSIM) index (Wang, Bovik, Sheikh et al. 2004; Wang, Bovik, and Simoncelli
2005).
12 http://www.itu.int/rec/T-REC-T.832-200903-I/en.