
Page 163 -
P. 163
142 3 Image processing
(a) (b) (c)
(d) (e) (f)
(g) (h) (i)
(j) (k) (l)
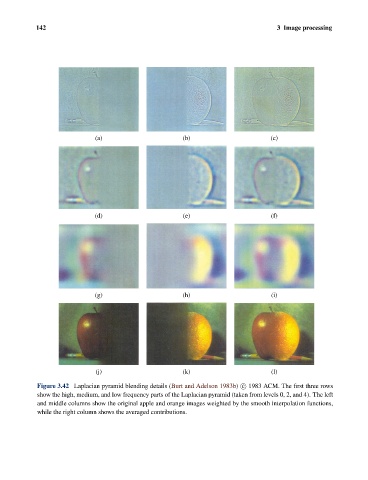
Figure 3.42 Laplacian pyramid blending details (Burt and Adelson 1983b) c 1983 ACM. The first three rows
show the high, medium, and low frequency parts of the Laplacian pyramid (taken from levels 0, 2, and 4). The left
and middle columns show the original apple and orange images weighted by the smooth interpolation functions,
while the right column shows the averaged contributions.