
Page 208 -
P. 208
4.1 Points and patches 187
(a)
(b) (c) (d)
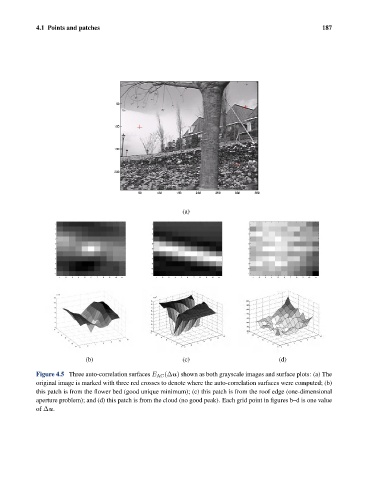
Figure 4.5 Three auto-correlation surfaces E AC (Δu) shown as both grayscale images and surface plots: (a) The
original image is marked with three red crosses to denote where the auto-correlation surfaces were computed; (b)
this patch is from the flower bed (good unique minimum); (c) this patch is from the roof edge (one-dimensional
aperture problem); and (d) this patch is from the cloud (no good peak). Each grid point in figures b–d is one value
of Δu.