
Page 209 -
P. 209
188 4 Feature detection and matching
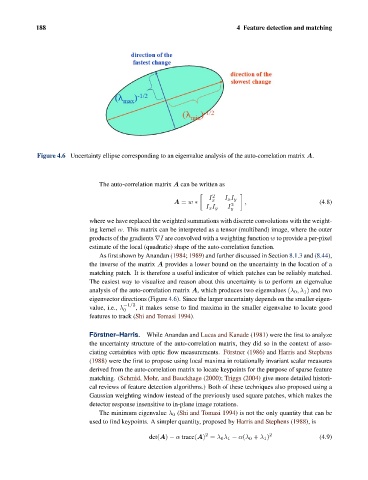
Figure 4.6 Uncertainty ellipse corresponding to an eigenvalue analysis of the auto-correlation matrix A.
The auto-correlation matrix A can be written as
2
I x I x I y
A = w ∗ 2 , (4.8)
I x I y I
y
where we have replaced the weighted summations with discrete convolutions with the weight-
ing kernel w. This matrix can be interpreted as a tensor (multiband) image, where the outer
products of the gradients ∇I are convolved with a weighting function w to provide a per-pixel
estimate of the local (quadratic) shape of the auto-correlation function.
As first shown by Anandan (1984; 1989) and further discussed in Section 8.1.3 and (8.44),
the inverse of the matrix A provides a lower bound on the uncertainty in the location of a
matching patch. It is therefore a useful indicator of which patches can be reliably matched.
The easiest way to visualize and reason about this uncertainty is to perform an eigenvalue
analysis of the auto-correlation matrix A, which produces two eigenvalues (λ 0 ,λ 1 ) and two
eigenvector directions (Figure 4.6). Since the larger uncertainty depends on the smaller eigen-
−1/2
value, i.e., λ 0 , it makes sense to find maxima in the smaller eigenvalue to locate good
features to track (Shi and Tomasi 1994).
F¨ orstner–Harris. While Anandan and Lucas and Kanade (1981) were the first to analyze
the uncertainty structure of the auto-correlation matrix, they did so in the context of asso-
ciating certainties with optic flow measurements. F¨ orstner (1986) and Harris and Stephens
(1988) were the first to propose using local maxima in rotationally invariant scalar measures
derived from the auto-correlation matrix to locate keypoints for the purpose of sparse feature
matching. (Schmid, Mohr, and Bauckhage (2000); Triggs (2004) give more detailed histori-
cal reviews of feature detection algorithms.) Both of these techniques also proposed using a
Gaussian weighting window instead of the previously used square patches, which makes the
detector response insensitive to in-plane image rotations.
The minimum eigenvalue λ 0 (Shi and Tomasi 1994) is not the only quantity that can be
used to find keypoints. A simpler quantity, proposed by Harris and Stephens (1988), is
2
det(A) − α trace(A) = λ 0 λ 1 − α(λ 0 + λ 1 ) 2 (4.9)