
Page 94 -
P. 94
2.3 The digital camera 73
0.4 2.0
r 1.8 x
0.3 1.6
g y
b 1.4 z
0.2 1.2
1.0
0.1 0.8
0.6
0.4
0.0
360 400 440 480 520 560 600 640 680 720 760 0.2
0.0
-0.1 360 400 440 480 520 560 600 640 680 720 760
(a) (b)
¯
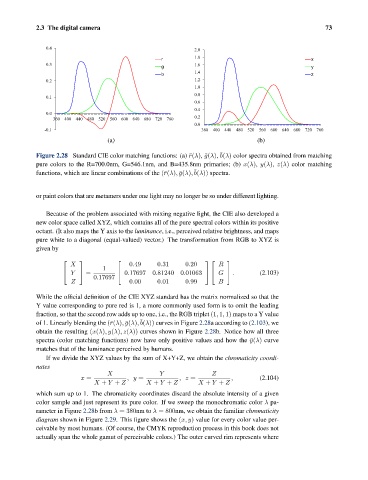
Figure 2.28 Standard CIE color matching functions: (a) ¯r(λ), ¯g(λ), b(λ) color spectra obtained from matching
pure colors to the R=700.0nm, G=546.1nm, and B=435.8nm primaries; (b) ¯x(λ), ¯y(λ), ¯z(λ) color matching
¯
functions, which are linear combinations of the (¯r(λ), ¯g(λ), b(λ)) spectra.
or paint colors that are metamers under one light may no longer be so under different lighting.
Because of the problem associated with mixing negative light, the CIE also developed a
new color space called XYZ, which contains all of the pure spectral colors within its positive
octant. (It also maps the Y axis to the luminance, i.e., perceived relative brightness, and maps
pure white to a diagonal (equal-valued) vector.) The transformation from RGB to XYZ is
given by
X 0.49 0.31 0.20 R
⎡ ⎤ ⎡ ⎤ ⎡ ⎤
1
Y = 0.17697 0.81240 0.01063 G . (2.103)
⎣ ⎦ ⎣ ⎦ ⎣ ⎦
0.17697
Z 0.00 0.01 0.99 B
While the official definition of the CIE XYZ standard has the matrix normalized so that the
Y value corresponding to pure red is 1, a more commonly used form is to omit the leading
fraction, so that the second row adds up to one, i.e., the RGB triplet (1, 1, 1) maps to a Y value
¯
of 1. Linearly blending the (¯r(λ), ¯g(λ), b(λ)) curves in Figure 2.28a according to (2.103), we
obtain the resulting (¯x(λ), ¯y(λ), ¯z(λ)) curves shown in Figure 2.28b. Notice how all three
spectra (color matching functions) now have only positive values and how the ¯y(λ) curve
matches that of the luminance perceived by humans.
If we divide the XYZ values by the sum of X+Y+Z, we obtain the chromaticity coordi-
nates
X Y Z
x = ,y = ,z = , (2.104)
X + Y + Z X + Y + Z X + Y + Z
which sum up to 1. The chromaticity coordinates discard the absolute intensity of a given
color sample and just represent its pure color. If we sweep the monochromatic color λ pa-
rameter in Figure 2.28b from λ = 380nm to λ = 800nm, we obtain the familiar chromaticity
diagram shown in Figure 2.29. This figure shows the (x, y) value for every color value per-
ceivable by most humans. (Of course, the CMYK reproduction process in this book does not
actually span the whole gamut of perceivable colors.) The outer curved rim represents where