
Page 95 -
P. 95
74 2 Image formation
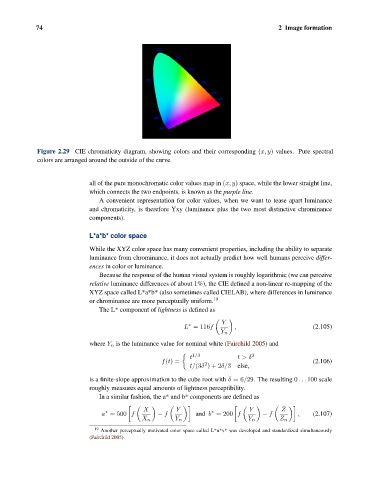
Figure 2.29 CIE chromaticity diagram, showing colors and their corresponding (x, y) values. Pure spectral
colors are arranged around the outside of the curve.
all of the pure monochromatic color values map in (x, y) space, while the lower straight line,
which connects the two endpoints, is known as the purple line.
A convenient representation for color values, when we want to tease apart luminance
and chromaticity, is therefore Yxy (luminance plus the two most distinctive chrominance
components).
L*a*b* color space
While the XYZ color space has many convenient properties, including the ability to separate
luminance from chrominance, it does not actually predict how well humans perceive differ-
ences in color or luminance.
Because the response of the human visual system is roughly logarithmic (we can perceive
relative luminance differences of about 1%), the CIE defined a non-linear re-mapping of the
XYZ space called L*a*b* (also sometimes called CIELAB), where differences in luminance
or chrominance are more perceptually uniform. 19
The L* component of lightness is defined as
Y
∗
L = 116f , (2.105)
Y n
where Y n is the luminance value for nominal white (Fairchild 2005) and
1/3 3
t t>δ
f(t)= (2.106)
2
t/(3δ )+2δ/3 else,
is a finite-slope approximation to the cube root with δ =6/29. The resulting 0 ... 100 scale
roughly measures equal amounts of lightness perceptibility.
In a similar fashion, the a* and b* components are defined as
è è
X Y Y Z
∗
a = 500 f − f and b = 200 f − f , (2.107)
∗
X n Y n Y n Z n
19 Another perceptually motivated color space called L*u*v* was developed and standardized simultaneously
(Fairchild 2005).