
Page 115 -
P. 115
Production and Supply Chain Management Information Systems
The Stock/Requirements List screen displays the inventory level for an individual
product, including all planned additions and reductions. In Figure 4-10, the production
plan for November is 6,377. Seventy percent of 6,377 is 4,464, which is shown in
Figure 4-12 as an independent requirement (IndReq). The independent requirements are
the output of the disaggregation of the sales and operations plan, and they are used in
95
master production scheduling to determine the schedule for finished product production.
Exercise 4.3
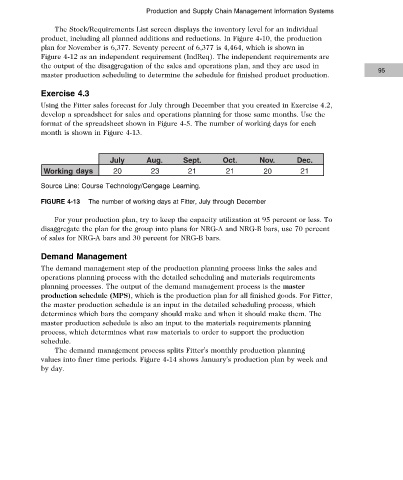
Using the Fitter sales forecast for July through December that you created in Exercise 4.2,
develop a spreadsheet for sales and operations planning for those same months. Use the
format of the spreadsheet shown in Figure 4-5. The number of working days for each
month is shown in Figure 4-13.
days 20 23 21 21 21
Source Line: Course Technology/Cengage Learning.
FIGURE 4-13 The number of working days at Fitter, July through December
For your production plan, try to keep the capacity utilization at 95 percent or less. To
disaggregate the plan for the group into plans for NRG-A and NRG-B bars, use 70 percent
of sales for NRG-A bars and 30 percent for NRG-B bars.
Demand Management
The demand management step of the production planning process links the sales and
operations planning process with the detailed scheduling and materials requirements
planning processes. The output of the demand management process is the master
production schedule (MPS), which is the production plan for all finished goods. For Fitter,
the master production schedule is an input in the detailed scheduling process, which
determines which bars the company should make and when it should make them. The
master production schedule is also an input to the materials requirements planning
process, which determines what raw materials to order to support the production
schedule.
The demand management process splits Fitter’s monthly production planning
values into finer time periods. Figure 4-14 shows January’s production plan by week and
by day.
Copyright 2012 Cengage Learning. All Rights Reserved. May not be copied, scanned, or duplicated, in whole or in part. Due to electronic rights, some third party content may be suppressed from the eBook and/or eChapter(s).
Editorial review has deemed that any suppressed content does not materially affect the overall learning experience. Cengage Learning reserves the right to remove additional content at any time if subsequent rights restrictions require it.