
Page 114 -
P. 114
94 Chapter 4
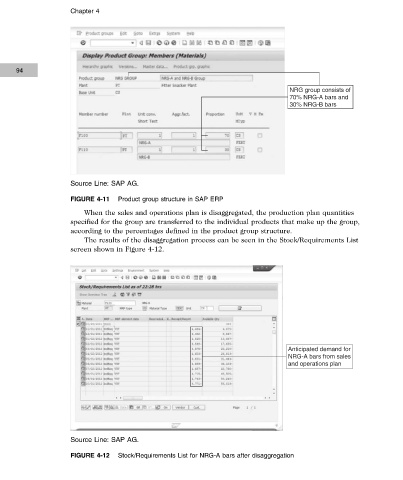
NRG group consists of
70% NRG‐A bars and
30% NRG‐B bars
Source Line: SAP AG.
FIGURE 4-11 Product group structure in SAP ERP
When the sales and operations plan is disaggregated, the production plan quantities
specified for the group are transferred to the individual products that make up the group,
according to the percentages defined in the product group structure.
The results of the disaggregation process can be seen in the Stock/Requirements List
screen shown in Figure 4-12.
Anticipated demand for
NRG‐A bars from sales
and operations plan
Source Line: SAP AG.
FIGURE 4-12 Stock/Requirements List for NRG-A bars after disaggregation
Copyright 2012 Cengage Learning. All Rights Reserved. May not be copied, scanned, or duplicated, in whole or in part. Due to electronic rights, some third party content may be suppressed from the eBook and/or eChapter(s).
Editorial review has deemed that any suppressed content does not materially affect the overall learning experience. Cengage Learning reserves the right to remove additional content at any time if subsequent rights restrictions require it.