
Page 109 -
P. 109
Production and Supply Chain Management Information Systems
level. If the user enters a value in this row, then SAP ERP will propose production levels to
meet the Target stock level. Once the Target stock level is entered, the system will
calculate the number of days’ worth of supply, so the fifth row (Days’ supply) is a
calculated result. The sixth row lets the user specify a target stock level in terms of the
number of days of demand it would cover, known as Target days’ supply. The SAP
89
system uses the factory calendar, which specifies company holidays and planned
shutdowns, to determine the number of working days in a month when calculating the
Target days’ supply.
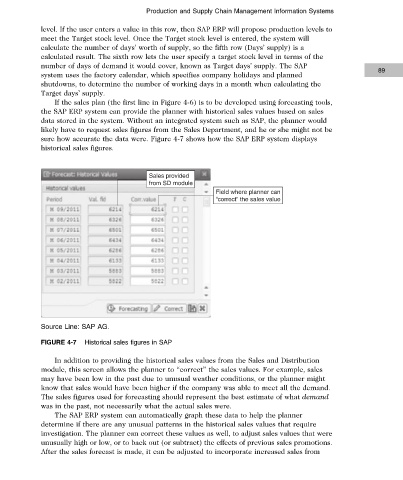
If the sales plan (the first line in Figure 4-6) is to be developed using forecasting tools,
the SAP ERP system can provide the planner with historical sales values based on sales
data stored in the system. Without an integrated system such as SAP, the planner would
likely have to request sales figures from the Sales Department, and he or she might not be
sure how accurate the data were. Figure 4-7 shows how the SAP ERP system displays
historical sales figures.
Sales provided
from SD module
Field where planner can
“correct” the sales value
Source Line: SAP AG.
FIGURE 4-7 Historical sales figures in SAP
In addition to providing the historical sales values from the Sales and Distribution
module, this screen allows the planner to “correct” the sales values. For example, sales
may have been low in the past due to unusual weather conditions, or the planner might
know that sales would have been higher if the company was able to meet all the demand.
The sales figures used for forecasting should represent the best estimate of what demand
was in the past, not necessarily what the actual sales were.
The SAP ERP system can automatically graph these data to help the planner
determine if there are any unusual patterns in the historical sales values that require
investigation. The planner can correct these values as well, to adjust sales values that were
unusually high or low, or to back out (or subtract) the effects of previous sales promotions.
After the sales forecast is made, it can be adjusted to incorporate increased sales from
Copyright 2012 Cengage Learning. All Rights Reserved. May not be copied, scanned, or duplicated, in whole or in part. Due to electronic rights, some third party content may be suppressed from the eBook and/or eChapter(s).
Editorial review has deemed that any suppressed content does not materially affect the overall learning experience. Cengage Learning reserves the right to remove additional content at any time if subsequent rights restrictions require it.