
Page 105 -
P. 105
April
Sales forecasting Production and Supply Chain Management Information Systems
March
Jan.
Feb.
May
June
Previous year (cases) 5734 5823 5884 6134 6587 6735
Promotion sales (cases) 300 300
Previous year base (cases) 5734 5823 5884 6134 6287 6435
Growth: 3.0% 172 175 177 184 189 193 85
Base projection (cases) 5906 5998 6061 6318 6476 6628
Promotion (cases) 500
Sales forecast (cases) 5906 5998 6061 6318 6476 7128
Source Line: Course Technology/Cengage Learning.
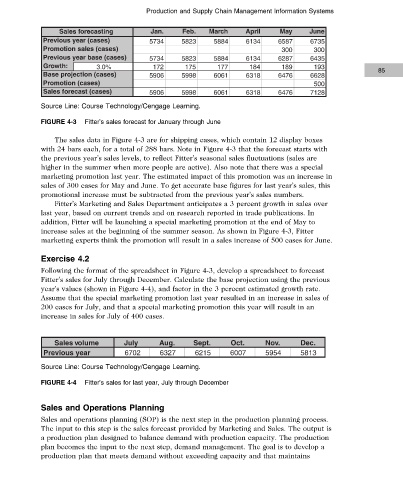
FIGURE 4-3 Fitter’s sales forecast for January through June
The sales data in Figure 4-3 are for shipping cases, which contain 12 display boxes
with 24 bars each, for a total of 288 bars. Note in Figure 4-3 that the forecast starts with
the previous year’s sales levels, to reflect Fitter’s seasonal sales fluctuations (sales are
higher in the summer when more people are active). Also note that there was a special
marketing promotion last year. The estimated impact of this promotion was an increase in
sales of 300 cases for May and June. To get accurate base figures for last year’s sales, this
promotional increase must be subtracted from the previous year’s sales numbers.
Fitter’s Marketing and Sales Department anticipates a 3 percent growth in sales over
last year, based on current trends and on research reported in trade publications. In
addition, Fitter will be launching a special marketing promotion at the end of May to
increase sales at the beginning of the summer season. As shown in Figure 4-3, Fitter
marketing experts think the promotion will result in a sales increase of 500 cases for June.
Exercise 4.2
Following the format of the spreadsheet in Figure 4-3, develop a spreadsheet to forecast
Fitter’s sales for July through December. Calculate the base projection using the previous
year’s values (shown in Figure 4-4), and factor in the 3 percent estimated growth rate.
Assume that the special marketing promotion last year resulted in an increase in sales of
200 cases for July, and that a special marketing promotion this year will result in an
increase in sales for July of 400 cases.
Sales volume July Aug. Sept. Oct. Nov. Dec.
Previous year 6702 6327 6215 6007 5954 5813
Source Line: Course Technology/Cengage Learning.
FIGURE 4-4 Fitter’s sales for last year, July through December
Sales and Operations Planning
Sales and operations planning (SOP) is the next step in the production planning process.
The input to this step is the sales forecast provided by Marketing and Sales. The output is
a production plan designed to balance demand with production capacity. The production
plan becomes the input to the next step, demand management. The goal is to develop a
production plan that meets demand without exceeding capacity and that maintains
Copyright 2012 Cengage Learning. All Rights Reserved. May not be copied, scanned, or duplicated, in whole or in part. Due to electronic rights, some third party content may be suppressed from the eBook and/or eChapter(s).
Editorial review has deemed that any suppressed content does not materially affect the overall learning experience. Cengage Learning reserves the right to remove additional content at any time if subsequent rights restrictions require it.