
Page 106 -
P. 106
Chapter 4
“reasonable” inventory levels (neither too high nor two low). This process requires
judgment and experience.
A sales and operations plan is developed from a sales forecast, and it determines how
Manufacturing can efficiently produce enough goods to meet projected sales. In Fitter’s
case, there is no way to make this determination, because Fitter does not produce a
86
formal estimate of sales. If Fitter had an ERP system, the calculation would be done as
described here.
We know that Fitter can produce 200 bars per minute, so we can estimate the
production capacity required by the sales forecast. Figure 4-5 shows Fitter’s sales and
operations plan for the first six months of the year.
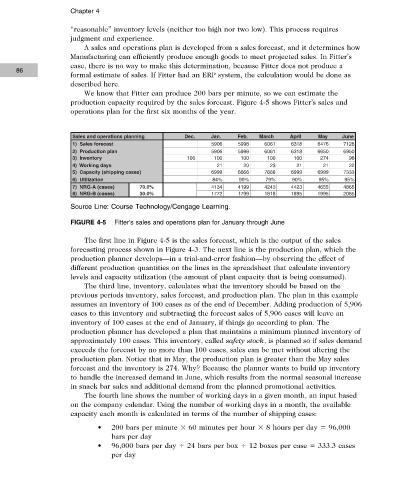
Sales and operations planning Dec. Jan. Feb. March April May June
1) Sales forecast 5906 5998 6061 6318 6476 7128
2) Production plan 5906 5998 6061 6318 6650 6950
3) Inventory 100 100 100 100 100 274 96
4) Working days 21 20 23 21 21 22
5) Capacity (shipping cases) 6999 6666 7666 6999 6999 7333
6) Utilization 84% 90% 79% 90% 95% 95%
7) NRG-A (cases) 70.0% 4134 4199 4243 4423 4655 4865
8) NRG-B (cases) 30.0% 1772 1799 1818 1895 1995 2085
Source Line: Course Technology/Cengage Learning.
FIGURE 4-5 Fitter’s sales and operations plan for January through June
The first line in Figure 4-5 is the sales forecast, which is the output of the sales
forecasting process shown in Figure 4-3. The next line is the production plan, which the
production planner develops—in a trial-and-error fashion—by observing the effect of
different production quantities on the lines in the spreadsheet that calculate inventory
levels and capacity utilization (the amount of plant capacity that is being consumed).
The third line, inventory, calculates what the inventory should be based on the
previous periods inventory, sales forecast, and production plan. The plan in this example
assumes an inventory of 100 cases as of the end of December. Adding production of 5,906
cases to this inventory and subtracting the forecast sales of 5,906 cases will leave an
inventory of 100 cases at the end of January, if things go according to plan. The
production planner has developed a plan that maintains a minimum planned inventory of
approximately 100 cases. This inventory, called safety stock, is planned so if sales demand
exceeds the forecast by no more than 100 cases, sales can be met without altering the
production plan. Notice that in May, the production plan is greater than the May sales
forecast and the inventory is 274. Why? Because the planner wants to build up inventory
to handle the increased demand in June, which results from the normal seasonal increase
in snack bar sales and additional demand from the planned promotional activities.
The fourth line shows the number of working days in a given month, an input based
on the company calendar. Using the number of working days in a month, the available
capacity each month is calculated in terms of the number of shipping cases:
• 200 bars per minute × 60 minutes per hour × 8 hours per day = 96,000
bars per day
• 96,000 bars per day ÷ 24 bars per box ÷ 12 boxes per case = 333.3 cases
per day
Copyright 2012 Cengage Learning. All Rights Reserved. May not be copied, scanned, or duplicated, in whole or in part. Due to electronic rights, some third party content may be suppressed from the eBook and/or eChapter(s).
Editorial review has deemed that any suppressed content does not materially affect the overall learning experience. Cengage Learning reserves the right to remove additional content at any time if subsequent rights restrictions require it.